
Figure 3.
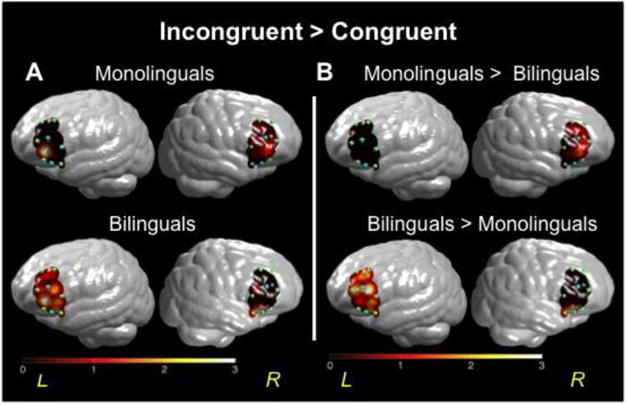
(A) T-values mapped for comparison of brain activation in prefrontal cortex for monolinguals (top row) and bilinguals (bottom row). Higher values on the scale indicate greater brain activity during the Incongruent condition, relative to Congruent trials. (B) T-value map for comparison of brain activation in prefrontal cortex in bilinguals versus monolinguals (the color bar reflects t-values).