
Fig. 2.
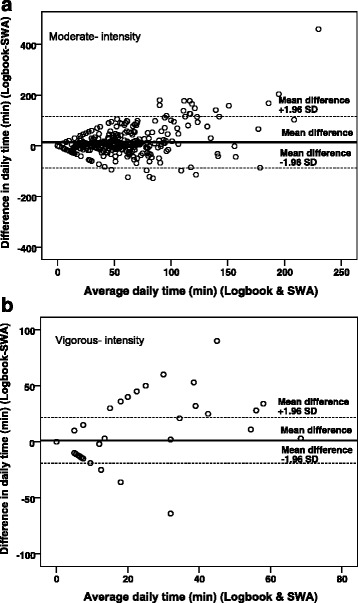
a Bland-Altman plot of the difference in daily time (min) spent in moderate- intensity physical activity between the logbook and the SenseWear Armband mini (SWA) against the average of values measured by the two methods with 95% limits of agreement. b Bland-Altman plot of the difference in daily time (min) spent in vigorous- intensity physical activity between the logbook and the SenseWear Armband mini (SWA) against the average of values measured by the two methods with 95% limits of agreement. Each point represents a pair of measurement (logbook and SWA) obtained from the 65 participants, who had valid data from four to seven days, totalling 409 comparisons. The thick lines indicate the mean difference and the broken lines indicate the limits of agreement