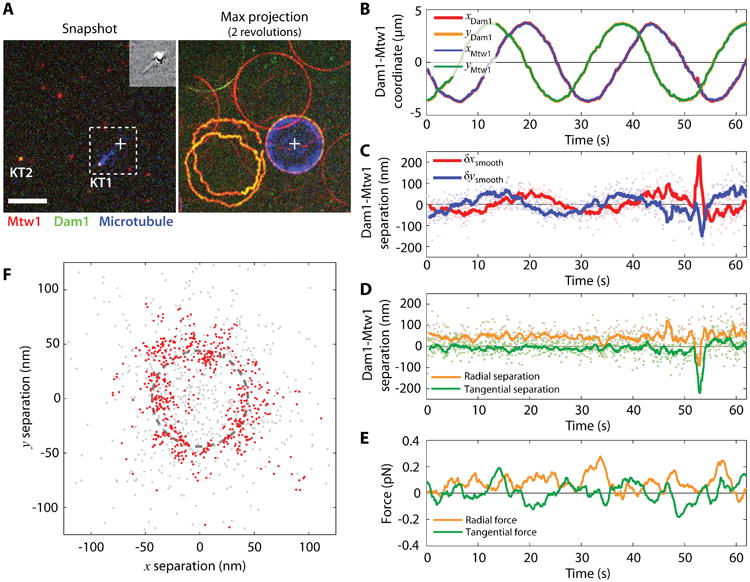
Figure 9.

Intra-kinetochore stretch measured by tracking the centroids of kinetochore components as the kinetochore is dragged on the lipid bilayer. (A) One frame of the three-color fluorescence movie (left). Kinetochore components Mtw1, Dam1, and microtubules are pseudo-colored red, green, and blue, respectively. The cross marks the position of the trapped bead. Inset shows the simultaneous DIC image. The maximum projection of two revolutions is shown on the right. KT1 and KT2 mark a dragged kinetochore and a freely diffusive kinetochore, respectively. Note that the circular path of the dragged kinetochore is smaller than the circular path followed by the piezo, as indicated in Fig. 9. Scale bar, 5 μm. (B) The Cartesian coordinates of kinetochore 1 (KT1) Mtw1 and Dam1 indicate circular trajectories. (C) The position of Dam1 relative to Mtw1 also varies sinusoidally, in-phase with the orientation of the microtubule. (D) The parallel (radial) and perpendicular (tangential) components indicate that Dam1 and Mtw1 are separated by 44 ± 33 nm (mean ± standard deviation). (E) The parallel (radial) and perpendicular (tangential) components of the microtubule tension measured by the trapped bead. (F) The positions of Dam1 relative to Mtw1 follow a circle of radius 44 ± 33 nm. Gray points show raw positions and red points show the same data after smoothing with a 1-second window average. Dashed line marks a circle of 44 nm radius.
