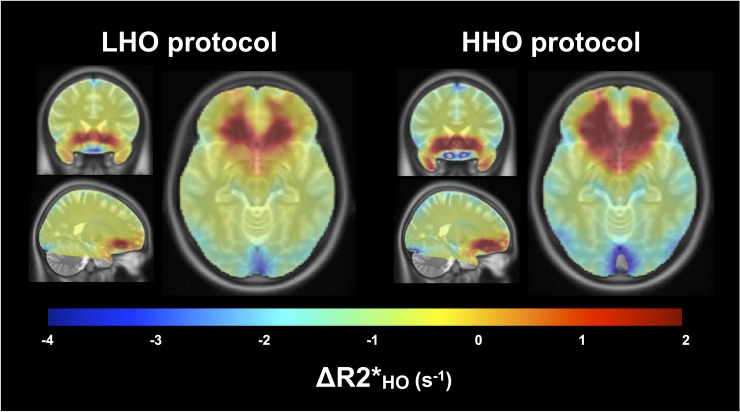
Fig 2. Susceptibility artifacts.
For each protocol, the averaged maps of ΔR2* during HO are shown in coronal, sagittal and axial views, overlaying the ICBM152 template. The chosen contrast window facilitates the localization of voxels where an increase in R2* is observed (in orange and red). These increases in the transverse relaxation rate are most likely the results of susceptibility artifacts attributable to the presence of paramagnetic O2 in frontal sinuses and nasal cavity.

