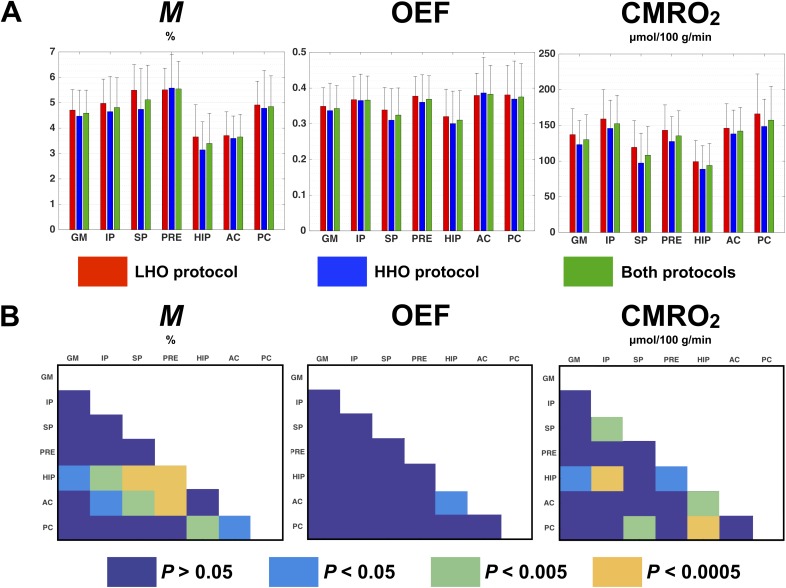
Fig 5. Protocol-averaged estimates in ROIs.
M, OEF and CMRO2 estimates averaged in different ROIs are compared. Fig 5-A presents the ROI-averaged value and standard deviation obtained under the LHO protocol (red bar), the HHO protocol (blue bar) and in both protocols averaged (green bar). Fig 5-B shows, for each estimate, any significant difference observed between ROIs after correcting for multiple comparisons (FWE, P < 0.05): dark blue indicates an absence of significant difference (P > 0.05), while light blue (P < 0.05), green (P < 0.005) and orange (P < 0.0005) illustrate a significant difference between two ROIs (represented in the X and Y axis). GM = gray matter, IP = inferior parietal, SP = superior parietal, PRE = precuneus, HIP = hippocampus, AC = anterior cingulate, PC = posterior cingulate.

