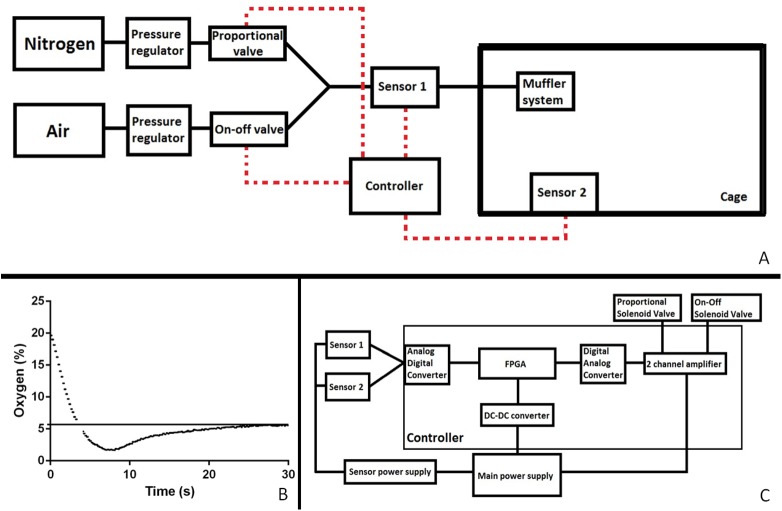
Fig 1.
A block diagram of the complete setup (A), the speed and pattern of lowering the oxygen to a set concentration (B), a block diagram detailing the controller and the dual sensor interface (C). The solid line denotes airflow and the dashed line the electrical connections. FPGA, field programmable gate array; DC-DC digital to digital converter.

