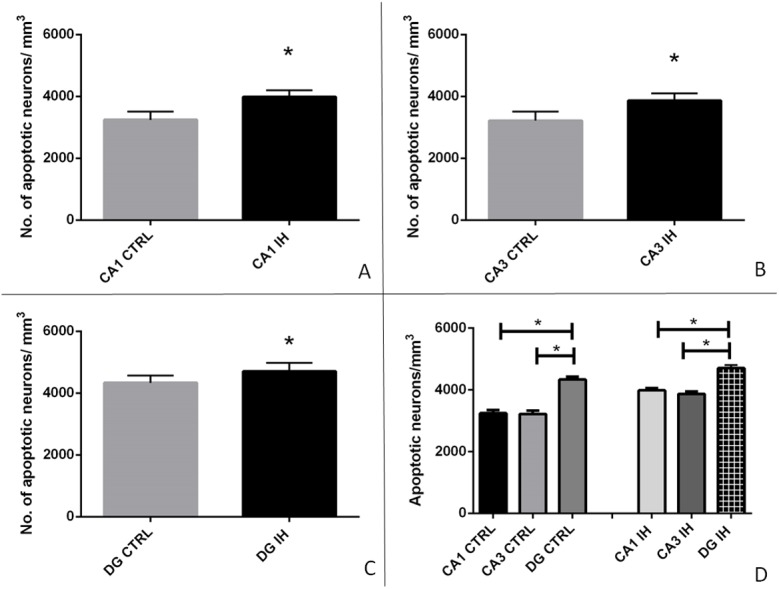
Fig 4.

Apoptotic neurons per mm3 of tissue in the control group (CTRL) compared to the intermittent hypoxia group (IH) in cornu ammonis 1(CA1) subfield (P< 0.001) (A), cornu ammonis 3 (CA3) subfield (P = 0.001) (B), and the dentate gyrus (DG) (P = 0.023) (C) shown as columns representing means and standard deviations. The number of apoptotic neurons differed significantly in the DG IH group opposed to CA1 IH (P<0,001), and CA3 IH (P<0,001), as well as in the DG CTRL group opposed to CA1 CTRL (P<0,001), and CA3 CTRL (P<0,001) (D). Asterisks denote statistically significant differences.
