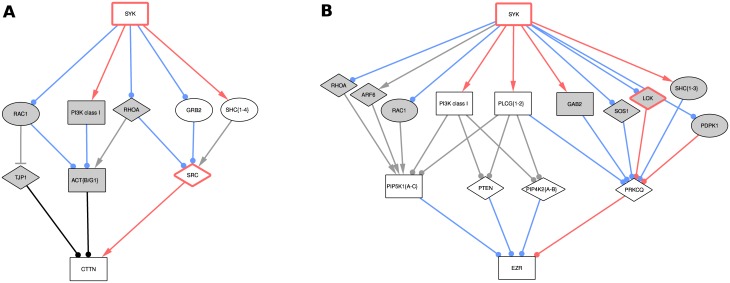
Fig 2. Proposed sub-networks for the effect of Syk on cortactin (A) and ezrin (B) identified by shortest paths analysis.
The grey nodes are only involved in the unweighted shortest paths, while the white ones are also involved in the weighted ones. The red borders denote phospho-tyrosine modifiers (tyrosine kinases and phosphatases). Note that some related proteins have been grouped in single nodes for clarity (denoted by curly brackets at the end of the name, and “PI3K class I”). Interactions annotated as “phosphorylation” (not particularly on tyrosine) appear in red, while “protein modifications” in general appear in blue. Line ends indicate the sign of the interaction: arrow for positive, T for negative, and circle for unknown. Finally, node shapes denote identified proteins: squares have identified differentially phosphorylated peptides (MDA231 dataset), circles correspond to differentially enriched proteins (MCF7 dataset), and diamonds are not part of the datasets.

