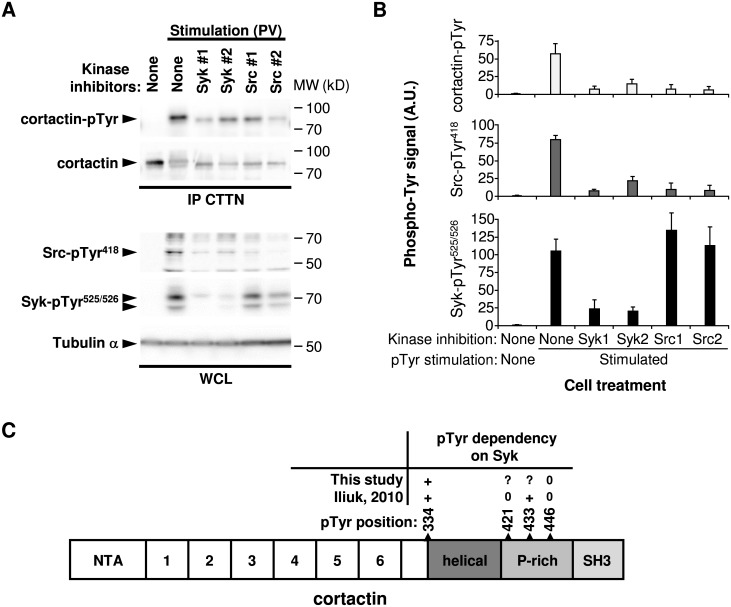
Fig 5. Syk controls cortactin tyrosine phosphorylation via the Src tyrosine kinase.
(A) Phosphorylation of indicated signaling proteins (left) in MCF7 cells that were treated with kinase inhibitors (Syk1, R406; Syk2, PRT062607; Src1, PP2; Src2, AZD0530) and either left unstimulated or stimulated with pervanadate (PV). CTTN, cortactin; IP, immunoprecipitation; WCL, whole cell lysate. Molecular weight standards (MW) are indicated (right). (B) Protein tyrosine phosphorylation of Syk, Src and cortactin quantified after pTyr stimulation and inhibition of Syk or Src catalytic activity. In the stimulated conditions, all the values obtained with the different inhibitors are statistically significant compared to the value obtained without inhibitor (P < 0.05; n = 3), except for the Syk phosphorylation with both Src inhibitors. (C) Cartoon illustrating the Syk-dependent cortactin tyrosine-phosphorylation. The structure of cortactin comprises an NTA region (NH2-terminal acidic), 6.5 tandem repeats (37 amino acids each), a helical region (helical), a proline-rich (P-rich) region, and a C-terminal SH3 domain. The localization of the identified phosphorylated tyrosines and their dependency on Syk are indicated (+, dependent; 0, independent;?, undetermined).

