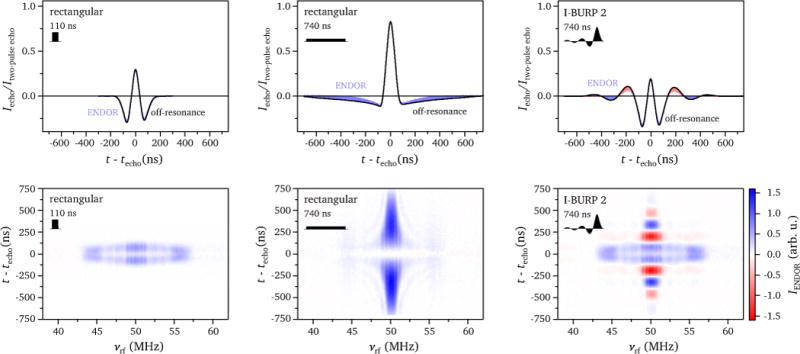
Figure 3.

ENDOR echo signals and ENDOR intensities: (top) off-resonance echo transients (black) and range of changes in the echo shape for different radiofrequencies in ENDOR experiments performed using rectangular inversion pulses with lengths of 110 ns and 740 ns and an I-BURP 2 inversion pulse with a length of 740 ns; (bottom) ENDOR intensity as a function of radiofrequency and time with respect to the echo maximum calculated from the echo transients according to Eq. (4). The experiments were performed on a frozen solution of Cu(His)2 at 13 K at the g⊥ field position of the copper spectrum at Q-band (1178.9 mT).
