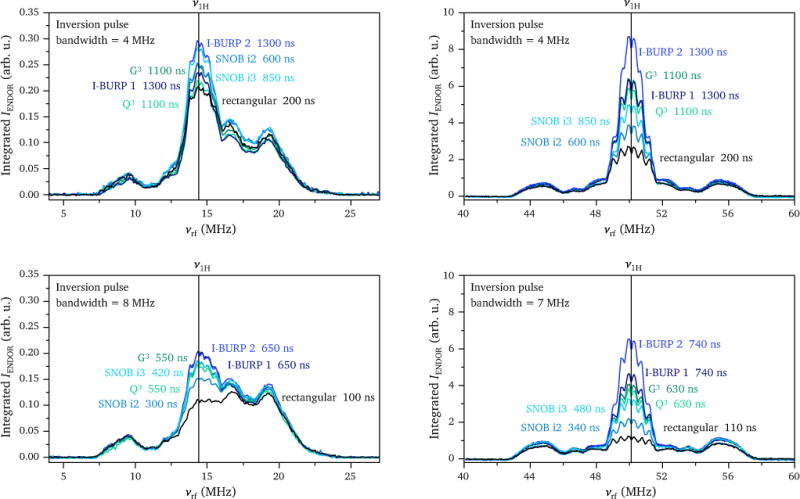
Figure 4.

X-band (left) and Q-band (right) echo-detected ENDOR spectra of Cu(His)2 in a frozen aqueous solution recorded with different inversion pulses. The inversion pulse lengths were adjusted to give an inversion bandwidth (defined as FWHM) of 4 MHz and 7 or 8 MHz as indicated in the corresponding graphs. The experiments were performed at the g⊥ field positions of the copper spectrum, corresponding to 338 mT at X-band and 1178.9 mT at Q-band. Further experimental details can be found in Section 2. The results of ENDOR experiments with band-selective inversion pulses are compared to the results obtained for a rectangular inversion pulse of the same bandwidth (black line). The integration windows were chosen to extend to the edges of the echo for the rectangular pulse and up to just before the second or fourth zero-crossing of the broad inverted echo on both sides of the echo maximum for band-selective pulses at X- and Q-band, respectively (these integration windows were found to give optimal signal-to-noise ratios in most cases).
