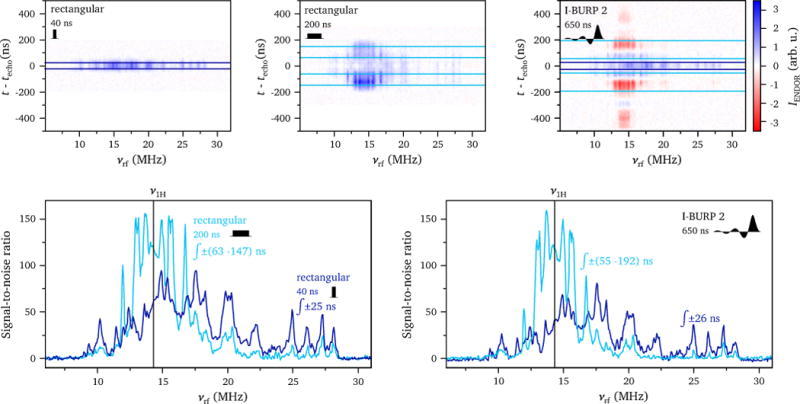
Figure 6.

(top) ENDOR intensity as a function of radiofrequency and time with respect to the echo maximum for rectangular inversion pulses with lengths of 40 ns and 200 ns and an I-BURP 2 pulse with a length of 650 ns. (bottom) X-band ENDOR spectra of a Cu-doped histidine crystal obtained using different inversion pulses and integration windows as indicated in the graphs. The experiments were performed at X-band on a Cu-doped histidine crystal at 10 K and a field position corresponding to g⊥ (337 mT). The detection sequence was with tπ = 20 ns and τ = 600 ns. The horizontal lines in the contour plots indicate the integration windows used to obtain the ENDOR spectra and were selected based on the optimal mean signal-to-noise ratio in the region containing the ENDOR peaks of interest.
