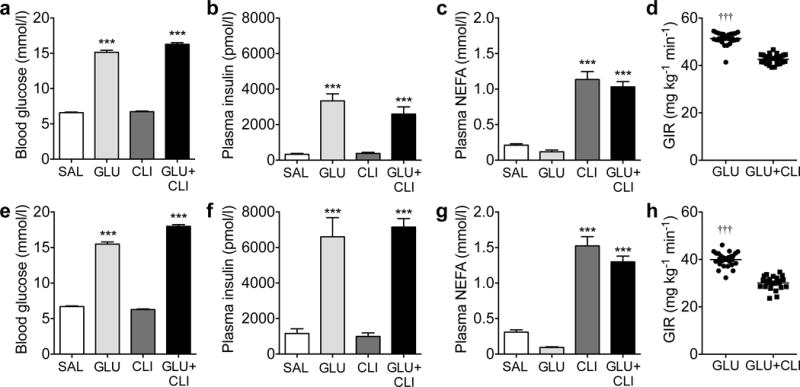
Fig. 1.

Characterisation of the nutrient-infused rat model. (a–d) Two-month-old and (e–h) 6-month-old rats were infused with SAL, GLU, CLI or GLU+CLI for 72 h. (a,e) Blood glucose, (b,f) plasma insulin and (c,g) plasma NEFA were measured during the infusion. Data are means±SEM (n=9–27). (d,h) Average GIR during the infusion. Data represent individual values and mean (n=21–27). For (a–c) and (e–g), ***p<0.001 vs SAL, ANOVA. For (d) and (h), †††p<0.001 vs GLU+CLI, unpaired Student’s t test
