Fig. 4.

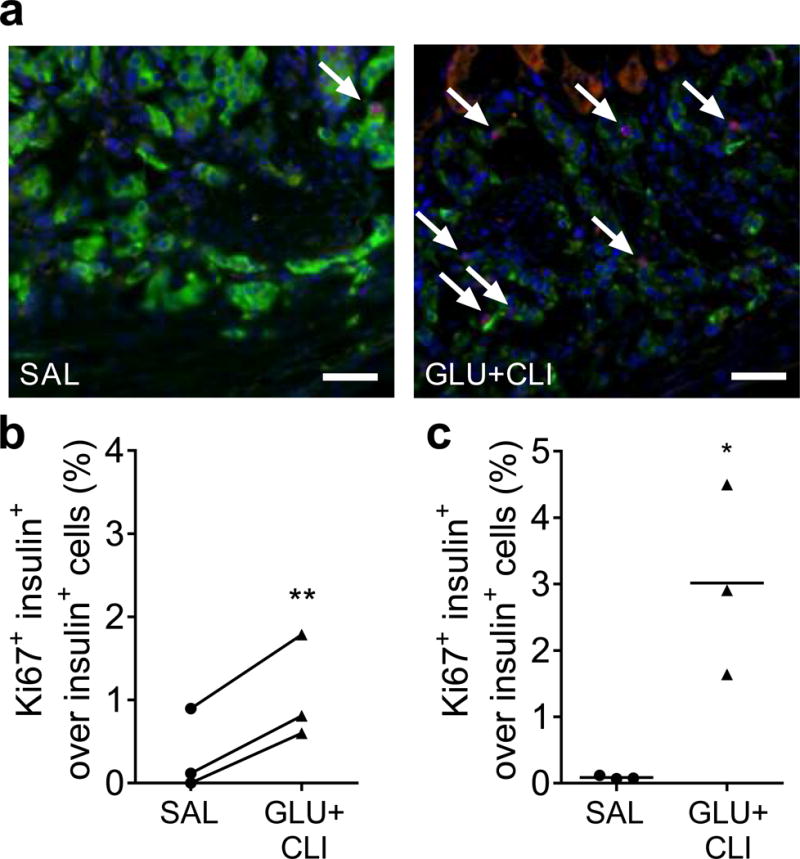
Measurement of beta cell proliferation in transplanted vs endogenous islets. Two-month-old rats were infused with nutrients. (a) Representative images of insulin (green), Ki67 (red) and nuclei (blue) staining in transplanted islets are shown. Arrows show positive nuclei for Ki67. The percentage of Ki67+ insulin+ cells over insulin+ cells in (b) transplanted and (c) endogenous islets was determined. Data represent individual values and mean (n=3). Scale bars, 50 μm. For (b), **p<0.01 vs SAL, paired Student’s t test. For (c), *p<0.05, unpaired Student’s t test
