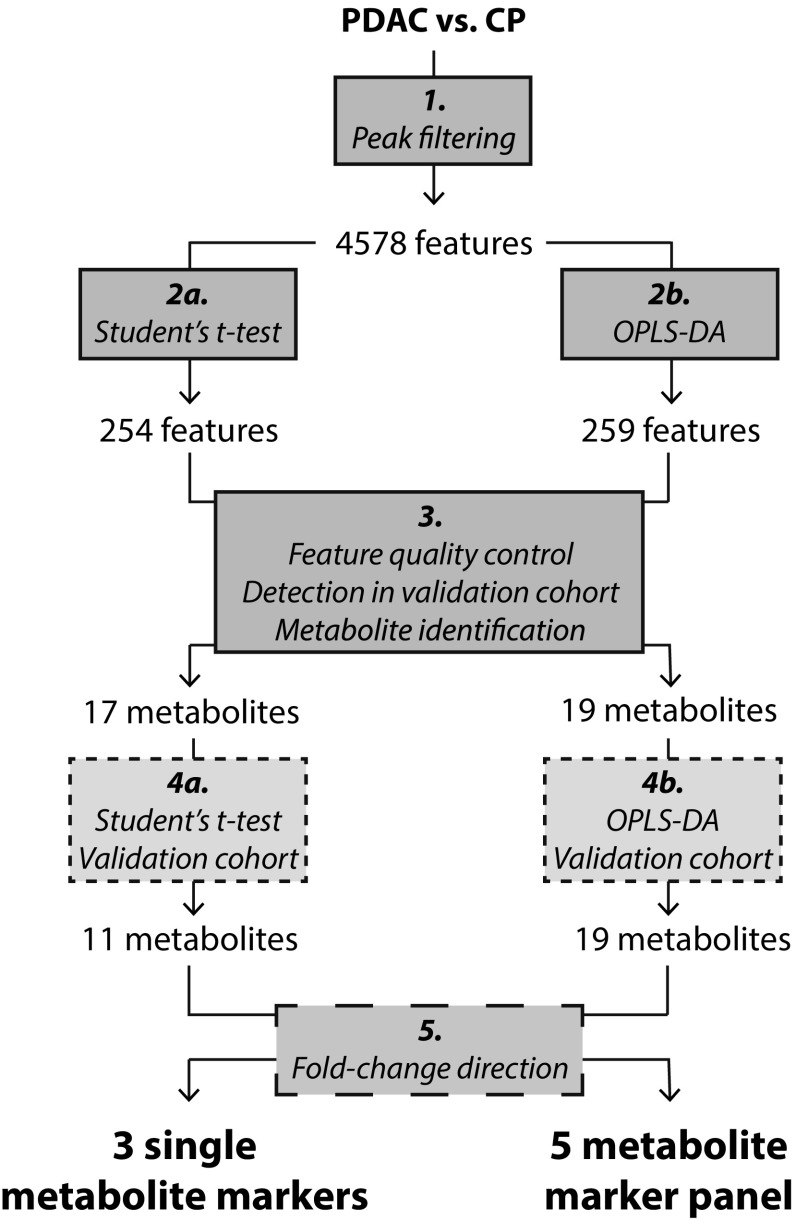
Fig. 1.
Schematic overview of data analysis workflow. Univariate (left) and multivariate (right) analyses comparing PDAC and CP were performed in parallel, starting with the abundance filtered discovery cohort data set (step 1). The large number of metabolite features (n = 4578) is due to superfluous features e.g. adducts and isotopes. Following statistical analysis of the discovery cohort (step 2a and b), selected metabolite features were examined manually in the raw data and low quality features (e.g. adducts, isotopes, low intensity peaks) were excluded (step 3). High quality features that were not present in the validation cohort were excluded as well, together with features that could not be identified. The discriminative capacity of the remaining identified features, now referred to as metabolites, was confirmed in the validation cohort by statistical analysis (step 4a and b). Finally, metabolites that were regulated in opposite directions in the two cohorts were excluded (step 5), resulting in three single metabolite markers and a panel of five metabolite markers

