
Fig. 5.
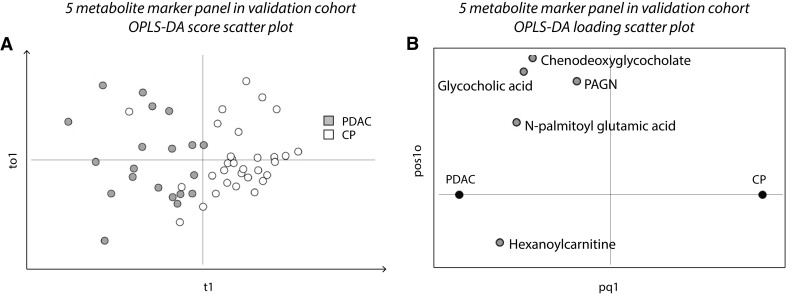
A marker panel of five metabolites discriminates PDAC and CP. a Score scatter plot for the refined OPLS-DA model of the five discriminative metabolites with consistent fold-change directions in the validation cohort (Fig. 1, step 4b and 5). Orange dots represent PDAC samples (n = 20); white dots represent CP samples (n = 31); t1 on the x-axis, first component; to1 on the y-axis, first (and only) orthogonal component. Model parameters: CV-groups, 5; R2X(cum) 0.736; Q2(cum) 0.513; CV-ANOVA p = 8.2E-07. b Corresponding loading scatter plot. All five metabolites in the marker panel show increased levels in PDAC compared to CP