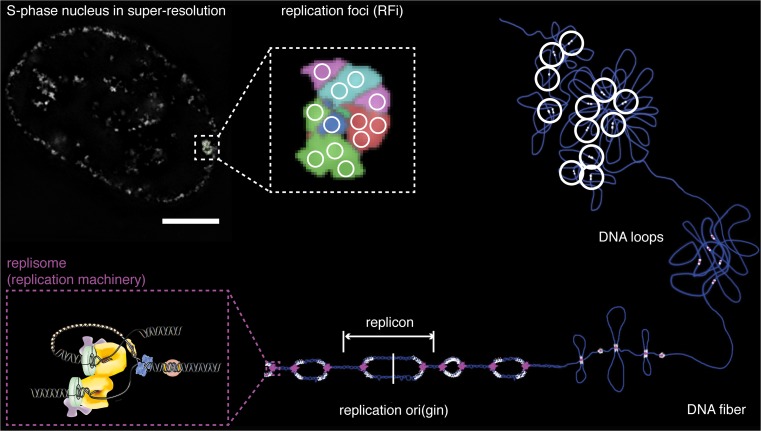
Fig. 2.
Organization of DNA replication from the genome to the individual replisome/replicon. A fluorescently labeled human HeLa Kyoto cell with a typical late S-phase replication pattern is presented in the top left corner (scale bar = 5 μm). Magnified super-resolution replication foci, with white circles representing individual replication sites displayed in the middle of the top row. A scheme of clustered DNA loops with active replication sites (white) is shown on the right. Starting point of DNA replication, the replication origin (ori), and the region replicated from a single origin displayed in the bottom row. Each replicon is replicated by two replication machineries (magenta), composed of various replication proteins, magnified in the bottom left corner. Adapted from (Chagin et al. 2016; Chagin et al. 2010)

