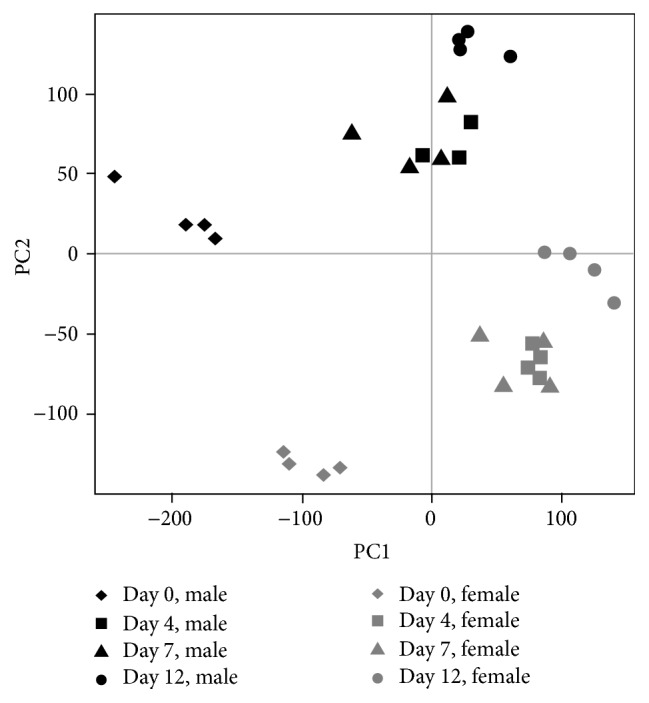
Figure 2.

2D snapshot of PCA analysis of sample distributions based on all genes. The day 0 samples were well separated from the day 12 samples indicating dramatic transcriptomic changes during the dedifferentiation process. Moreover, the day 4 and day 7 samples were close together indicating small-magnitude transcriptomic changes between days 4 and 7.
