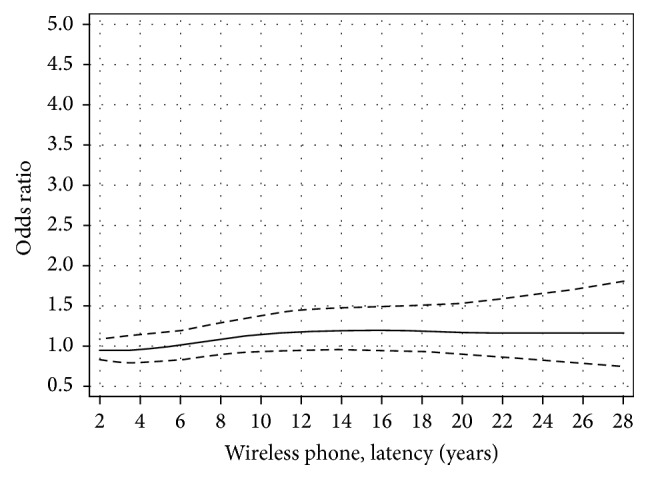
Figure 3.

Restricted cubic spline plot of the relationship between latency of wireless phones and meningioma. The solid line indicates the OR estimate and the broken lines represent the 95% CI. Adjustment was made for age at diagnosis, gender, socioeconomic index (SEI), and year for diagnosis.
