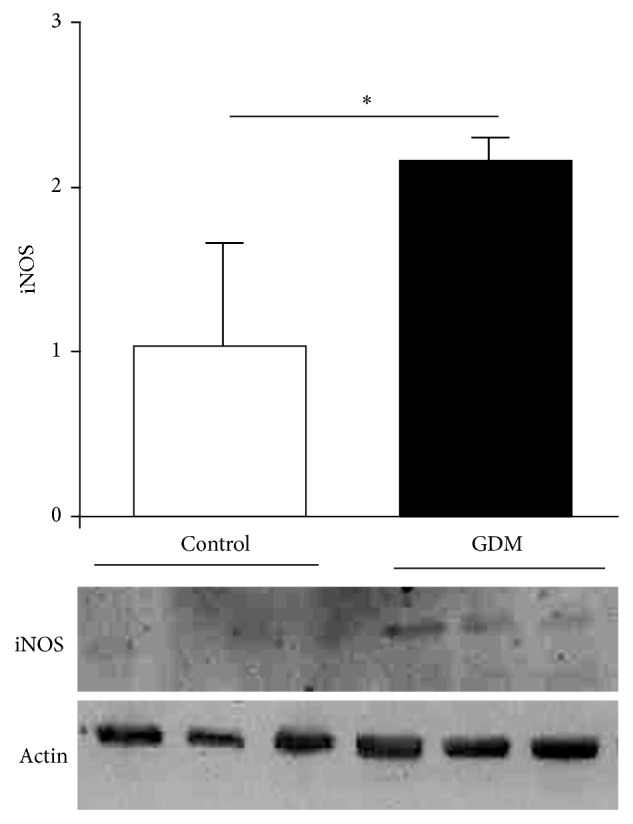
Figure 1.

iNOS expression in GDM. Notes. iNOS expression quantified by Western blot of placental tissue obtained from control and GDM pregnancies. Results are expressed as means ± SEM of iNOS to actin ratio measured by densitometry (n = 3). Lower panel is a representative image from an experiment. Units on bar chart y-axis are arbitrary. ∗p < 0.05, GDM versus control.
