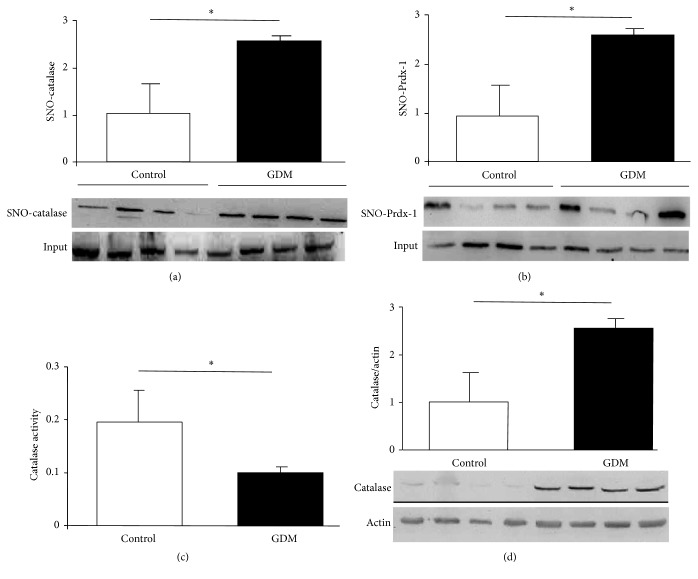
Figure 2.
S-Nitrosylation in antioxidant enzymes. Notes. ((a) and (b)) S-Nitrosylation measured in placental tissue obtained from control and GDM pregnancies. Methods used were biotin-switch technique for catalase (a) and peroxiredoxin-1 (b). Results in bar charts are mean ± SEM of SNO-protein (n = 6) relative to input (total quantity of studied protein present in each sample). Units on bar chart y-axes are arbitrary. Representative images of immunoblotted SNO-proteins are shown under each graph. Catalase activity (c) and expression (d) were quantified by spectrophotometric analysis and immunoblotting, respectively. Placental tissues were obtained from control and GDM pregnancies. Results reported as mean ± SEM of enzymatic activity (n = 8) and catalase to actin ratio measured by densitometry (n = 3); lower panel is a representative image of immunoblotted proteins. ∗p < 0.05, GDM versus control.

