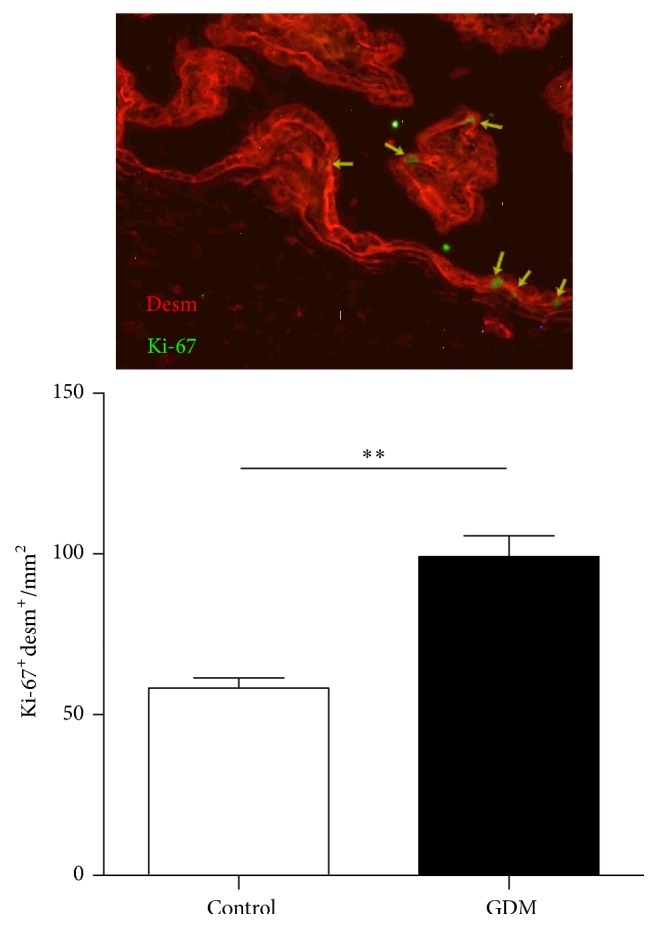
Figure 4.

Proliferation level in trophoblasts. Notes. Cytotrophoblast proliferation quantified by immunohistochemistry in control and GDM placental tissue. Results are expressed as means ± SEM of desmosome protein (desm) and Ki-67 positive cells per area (mm2) (n = 7). Upper panel is a representative image of desmosome protein (red) and Ki-67 (green) immunostaining. Units on y-axes of bar charts are arbitrary. ∗∗p < 0.01, GDM versus control.
