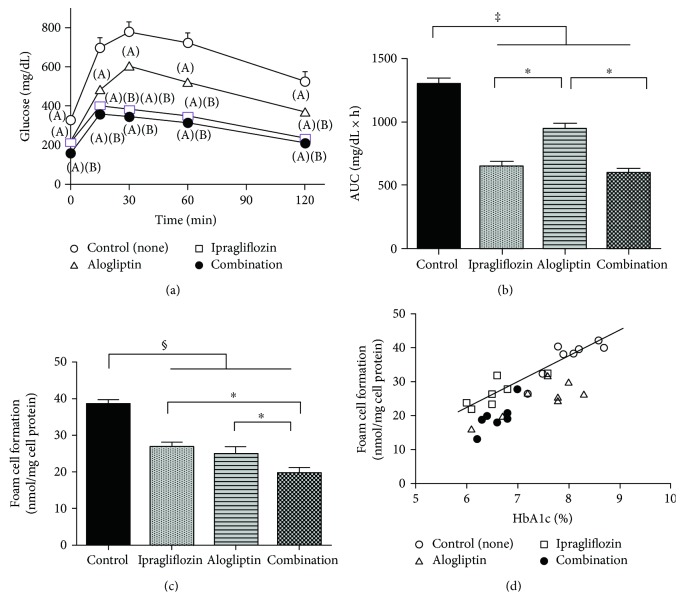
Figure 1.
(a) Oral glucose tolerance test in db/db mice treated with none, ipragliflozin, alogliptin, ipragliflozin plus alogliptin (combination). p < 0.05 versus control (A); p < 0.05 versus alogliptin (B). (b) The area under the blood glucose curve for OGTTs. ∗p < 0.05, ‡p < 0.001. (c) Foam cell formation of peritoneal macrophages in db/db mice.∗p < 0.05, §p < 0.0005. (d) Correlation between macrophage foam cell formation and hemoglobin A1c (HbA1c) levels in db/db mice. The line indicates the correlation curves for the control and ipragliflozin groups.

