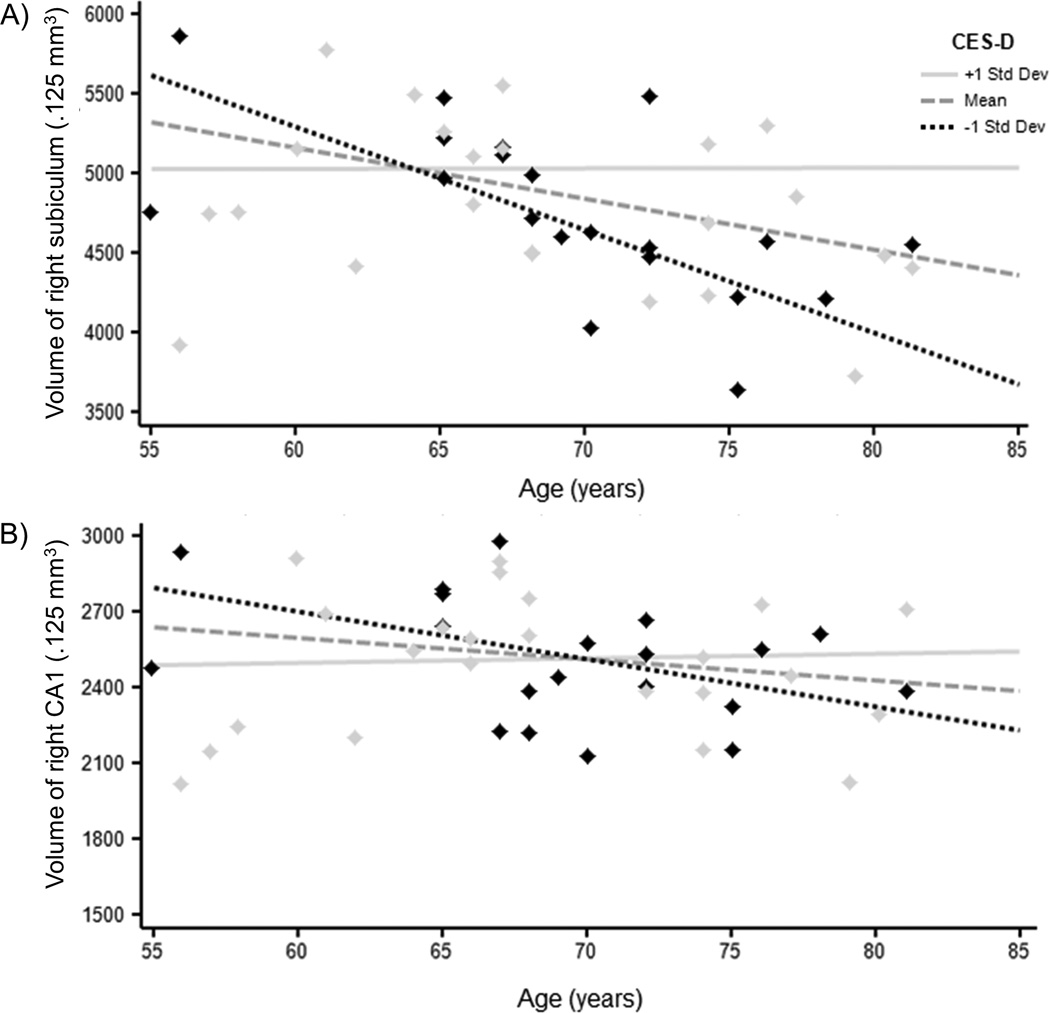
Figure 1.
Significant results for the age × CES-D interactions on volumes in the A) right subiculum, and B) right CA1. Raw scores are presented for ease of display, but age and CES-D scores were entered as continuous variables in the statistical models and were centered around the mean in all analyses. CES-D = Center for Epidemiologic Studies Depression Scale; CA = cornu ammonis; mm = millimeters.

