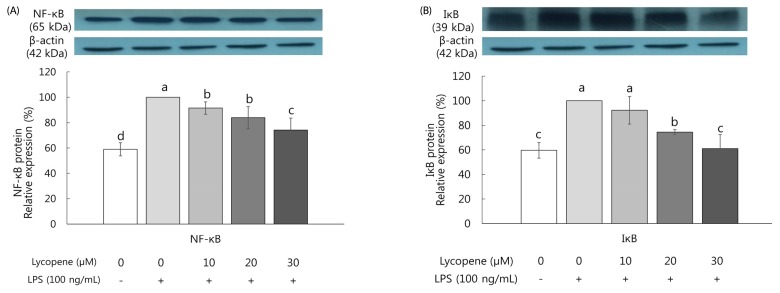
Fig. 5. Effects of lycopene on protein expression of NF-κB (A) and IκB (B) in LPS-stimulated SW480 cells.
Protein expression was measured by western blot assay. Actin was used as an internal control in a densitometric analysis. Each graph represents the mean ± SE of three independent experiments. Comparison among concentration of lycopene that yielded significant differences at α = 0.05 as indicated by different letters above each graph by Duncan's multiple range test.

