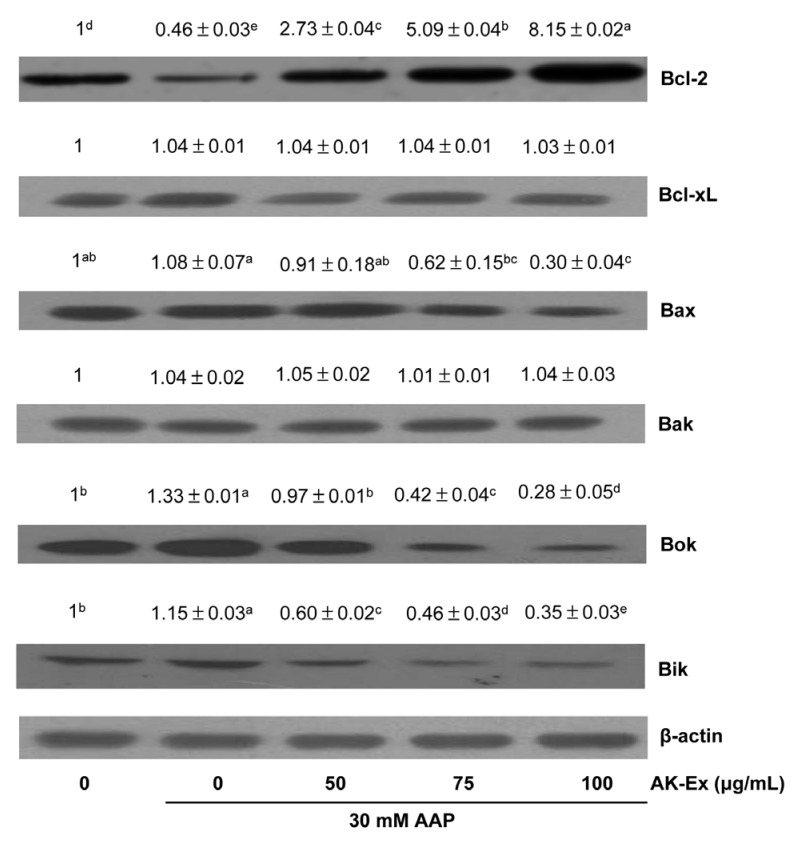
Fig. 6. Effect of AK-Ex on the protein levels of Bal-2 family proteins in HepG2 cells.
Cells were plated at a density of 1 × 10⁶ cells/dish in 100 mm dishes and treated with AK-Ex and/or AAP, as described in Fig. 3. Cell lysates were analyzed by western blotting with the indicated antibodies. Photographs of the chemiluminescent detection of the blots, which are representative of three independent experiments, are shown. Relative abundance of each band to their own β-actin level was quantified and the control levels were set at 1. The adjusted mean ± SEM values (n = 3) of each band are shown above each blot. Means without a common letter differ significantly, P < 0.05.

