
FIGURE 2.
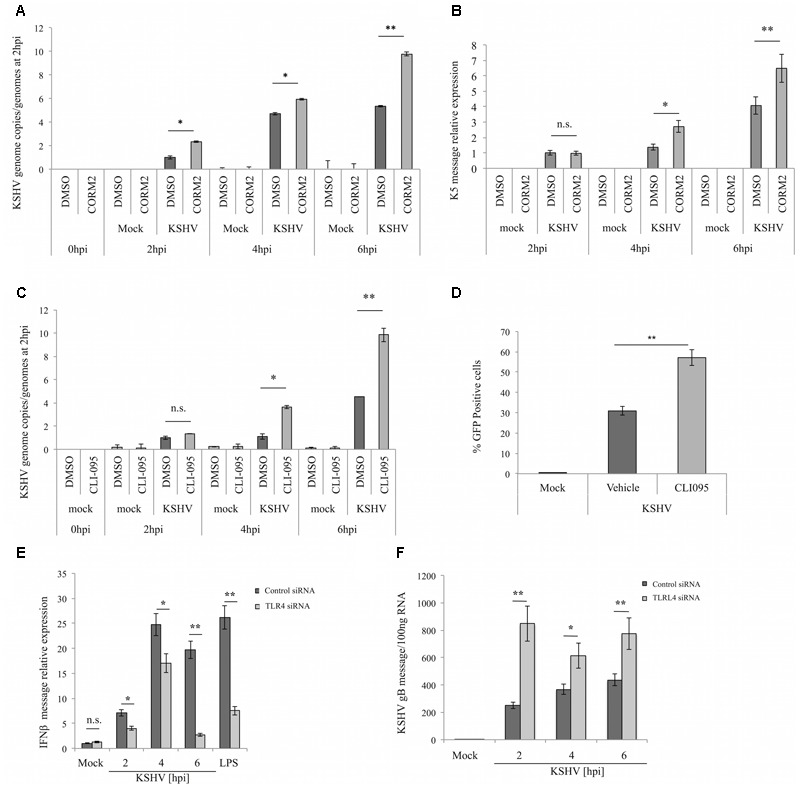
TLR4 inhibition via CO or TLR4 inhibitor CLI-095 facilitates KSHV infection of iLEC. (A) qPCR for KSHV genome copies in iLEC pretreated with DMSO control (dark gray) or 10 μM CORM-2 (light gray) for 10 min and then infected with KSHV-BAC16. KSHV genome copies are represented as relative to the number of genomes present at 2 hpi. Data are expressed as the mean ± SEM (n = 3). (B) qPCR for KSHV K5 transcript in iLEC pretreated with DMSO control (dark gray) or 10 μM CORM-2 (light gray) for 10 min and then infected with KSHV-BAC16. KSHV K5 levels are represented as relative to K5 levels measured at 2 hpi. Data are expressed as the mean ± SEM (n = 3). (C) qPCR for KSHV genome copies in iLEC pretreated with DMSO control (dark gray) or 3 μM CLI-095 (light gray) and then infected with KSHV-BAC16. KSHV genome copies are represented as relative to the number of genomes present at 2 hpi. Data are expressed as the mean ± SEM (n = 3). (D) Flow cytometry for iLEC pretreated with DMSO (Vehicle) or 3 μM TLR4-inhibitor (CLI-095) and then infected with KSHV-BAC16. Infection is quantified by determining the percentage of GFP positive cells present at 24 hpi. Data are expressed as the mean ± SEM (n = 3). qPCR for IFNβ (E) and gB (F) message levels in iLEC transfected overnight with Control siRNA (dark gray) or TLR4 siRNA (light gray) and then infected with KSHV for 2, 4, and 6 h. LPS (100 ng/ml for 4 h) was used as a control stimulus for TLR4 activation. Data are expressed as the mean ± SEM (n = 3). A one-way ANOVA test was used for statistical analysis. ∗p-value ≤ 0.05, ∗∗p-value ≤ 0.01.