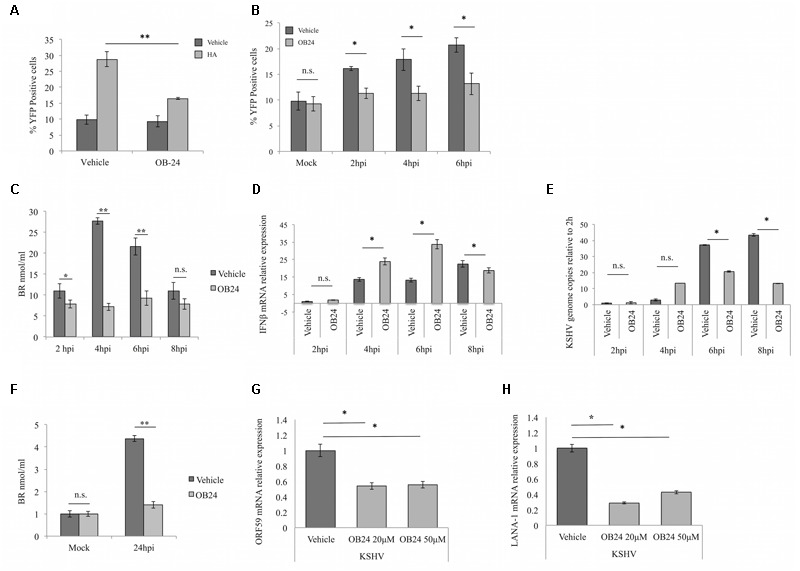
FIGURE 3.

Heme oxygenase-1 inhibition results in decreased KSHV infection in iLEC and CO production. (A) Flow cytometric analysis of HeLa-COSer cells pretreated overnight with PBS control (Vehicle) or 20 μM HO-1 inhibitor OB-24 (OB-24) and then stimulated with PBS (Vehicle; dark gray) or 5 μM heme arginate (HA; light gray) for 4 h. CO production is measured by percentage of YFP positive cells. Data are expressed as the mean ± SEM (n = 3). (B) Flow cytometry for HeLa-COSer cells pretreated with PBS vehicle (dark gray) or 20 μM of the HO-1 enzyme activity inhibitor OB-24 (light gray) overnight and then infected with KSHV. CO production is measured by quantitation of the percentage of YFP positive cells. Data are expressed as the mean ± SEM (n = 3). (C) ELISA for intracellular bilirubin levels as a measure of HO-1 activity. iLEC were pre-treated with PBS (Vehicle; dark gray) or 20 μM OB-24 (light gray) overnight, infected with KSHV-BAC16 and then harvested for analysis at different times post-infection (2, 4, 6, and 8 hpi). Data are expressed as the mean ± SEM (n = 2). (D,E) qPCR for IL-1β mRNA (D) and KSHV genome copies (E) in iLEC pretreated overnight with PBS (Vehicle, dark gray) or 20 μM OB-24 (OB24; light gray), infected with KSHV-BAC16 and harvested for analysis at 2, 4, 6, and 8 hpi. Data are expressed as the mean ± SEM (n = 3). KSHV genome copies are represented as relative to the number of genomes present at 2 hpi. (F) ELISA for intracellular bilirubin levels in iLEC pretreated with PBS (Vehicle; dark gray) or 20 μM OB-24 (light gray) overnight and then infected with KSHV for 24 h before harvest and analysis. Data are expressed as the mean ± SEM (n = 2). (G,H) qPCR for KSHV lytic transcript ORF59 (G) and latent transcript LANA-1 (H) in iLEC pretreated overnight with PBS (Vehicle; dark gray) or with OB-24 at 20 μM or 50 μM (light gray) and then infected with KSHV-BAC16 for 24 h before harvest and analysis. KSHV transcript levels are represented as relative to transcript levels measured at 2 hpi. Data are expressed as the mean ± SEM (n = 3). ∗p-value ≤ 0.05, ∗∗p-value ≤ 0.01. A one-way ANOVA test was used for statistical analysis.
