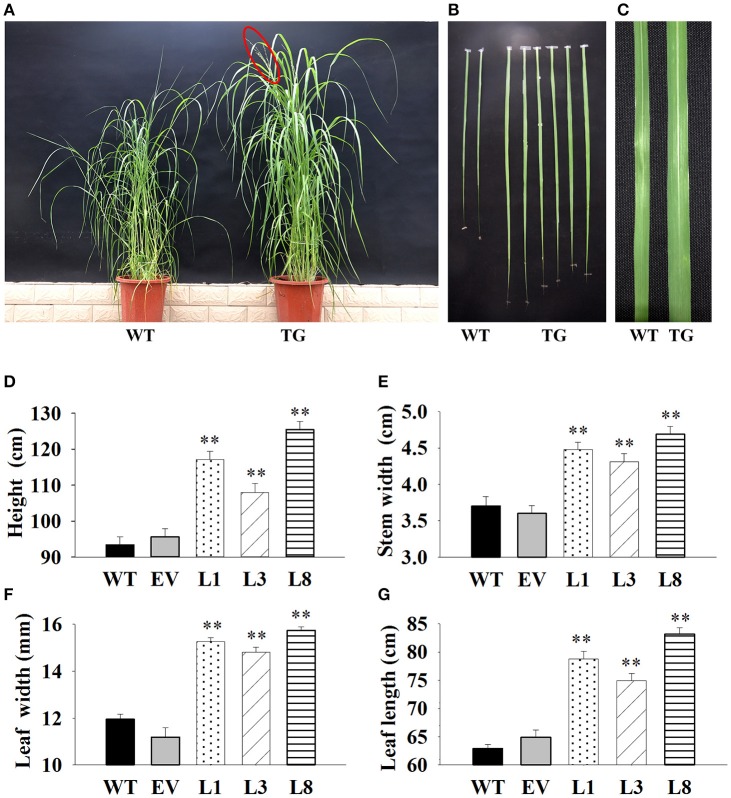
Figure 4.
Phenotypic comparison of transgenic switchgrass under normal conditions. (A): Phenotypes of whole plants (A), leaf length (B) and leaf width (C); Statistical analysis of plant height (D), stem diameter (E), leaf width (F) and leaf length (G). WT, wild type; TG, transgenic plants of PvNHX1; EV, transgenic lines expressing the empty vector only; L1, L3, and L8: different transgenic lines overexpressing PvNHX1. *Indicates significant differences from the WT at P <0.05; **indicates significant differences from the WT at P <0.01.

