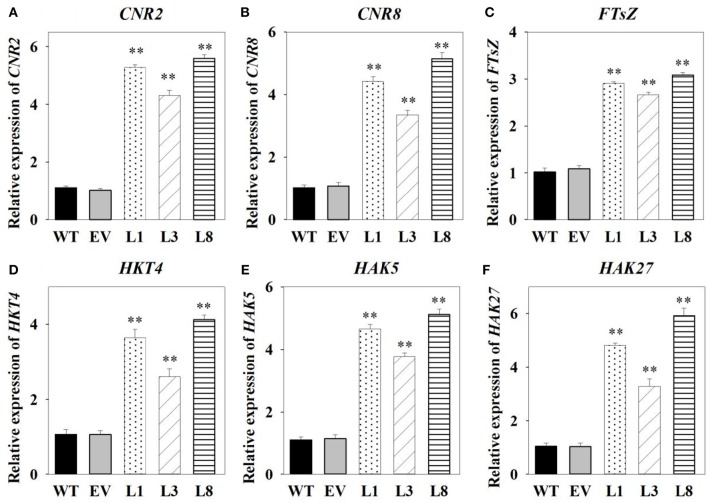
Figure 8.
Expression levels analysis of cell growth-, potassium transport-related genes in transgenic switchgrass. Expression levels of CNR2 (A), CNR8 (B), FTsZ (C), HKT4 (D), HAK5 (E), and HAK27 (F). The data shows the mean ± S.E of three replicate samples. * and ** indicate a significant difference from that of WT at P <0.01, respectively.

