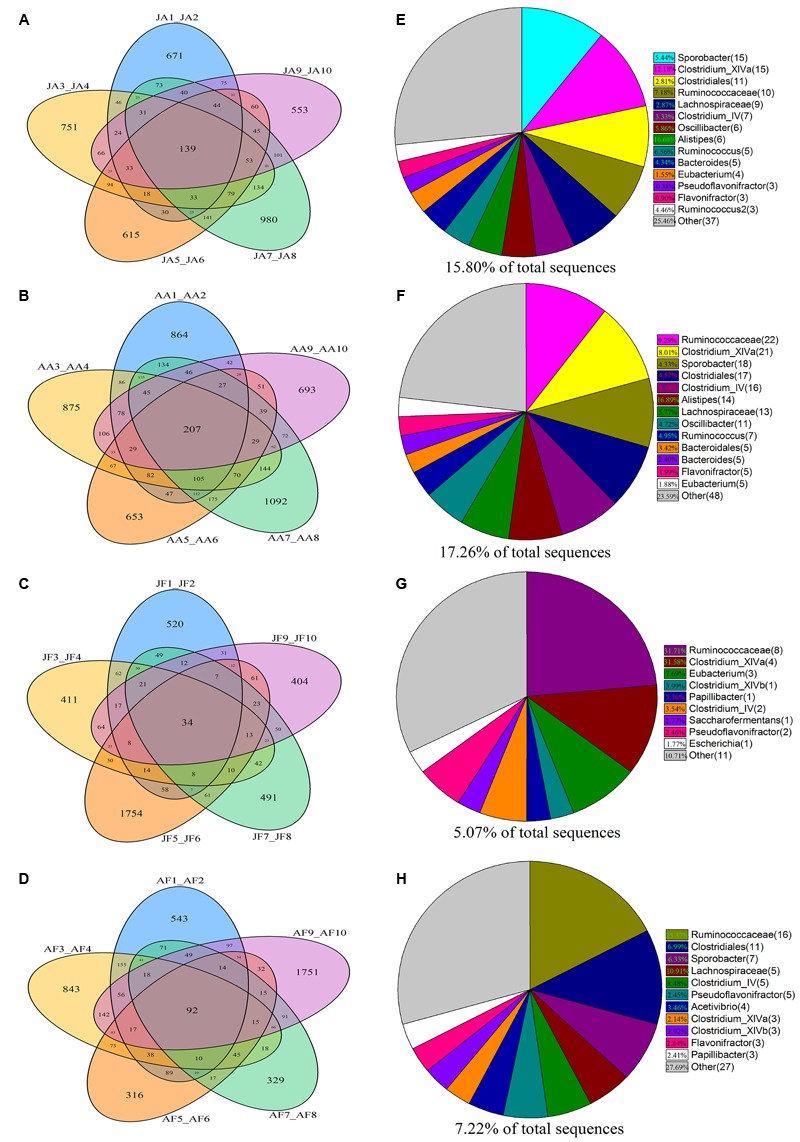
FIGURE 1.

Distribution of bacterial taxa within the four sample groups. The Venn diagrams shows the numbers of OTUs (97% sequence identity) that were shared or unshared by the individuals of (A) juvenile alpine musk deer (JA), (B) adult alpine musk deer (AA), (C) juvenile forest musk deer (JF) and (D) adult forest musk deer (AF), respectively, depending of overlaps. For presentation two individuals had to be combined (e.g., JA1_JA2) thereby reflecting the number of OTUs shared by those two individuals. The pie diagrams show the core bacterial composition of groups: (E) JA, (F) AA, (G) JF and (H) AF. The taxa that occurred at low abundance were included as “other.”
