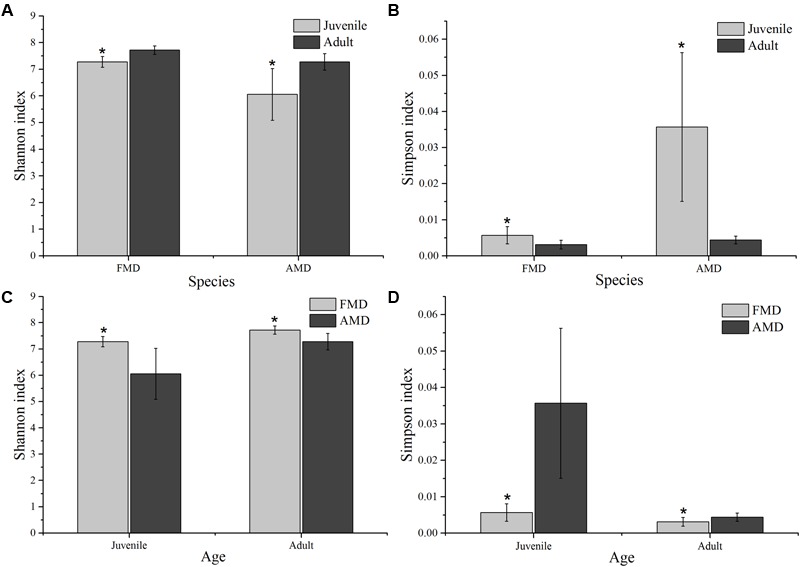
FIGURE 3.

Age-related differences in microbial diversity (Shannon and Simpson) between alpine (AMD) and forest musk deer (FMD). Graphs (A,B) represent the comparison of Shannon and Simpson index between juvenile and adult. Graphs (C,D) represent the comparison of Shannon and Simpson index between AMD and FMD. The significance of Shannon and Simpson indices were determined using the independent-sample t-test. ∗Means that a significant difference was found.
