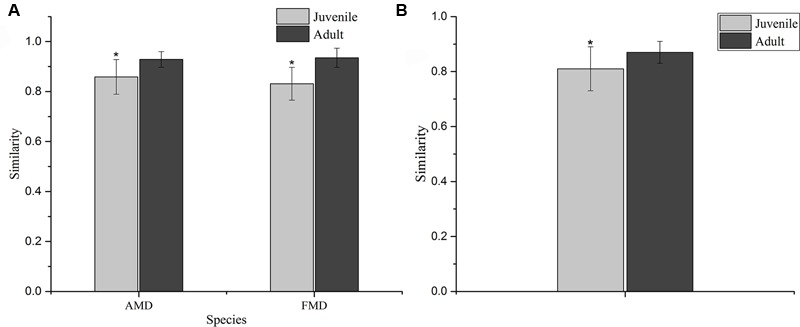
FIGURE 4.

Similarity of the bacterial communities within (A) and between (B) age groups of alpine (AMD) and forest musk deer (FMD). The similarity was calculated as the average of the pairwise similarity between each paired sample using the Bray–Curtis metric. Y-axis represents the degree of similarity: the closer the similarity is to 1, the higher the average similarity within a group. ∗ Represents the significant differences in within-group and between-group similarity between age groups, the significance values have been calculated using t-test analysis.
