Figure 1.

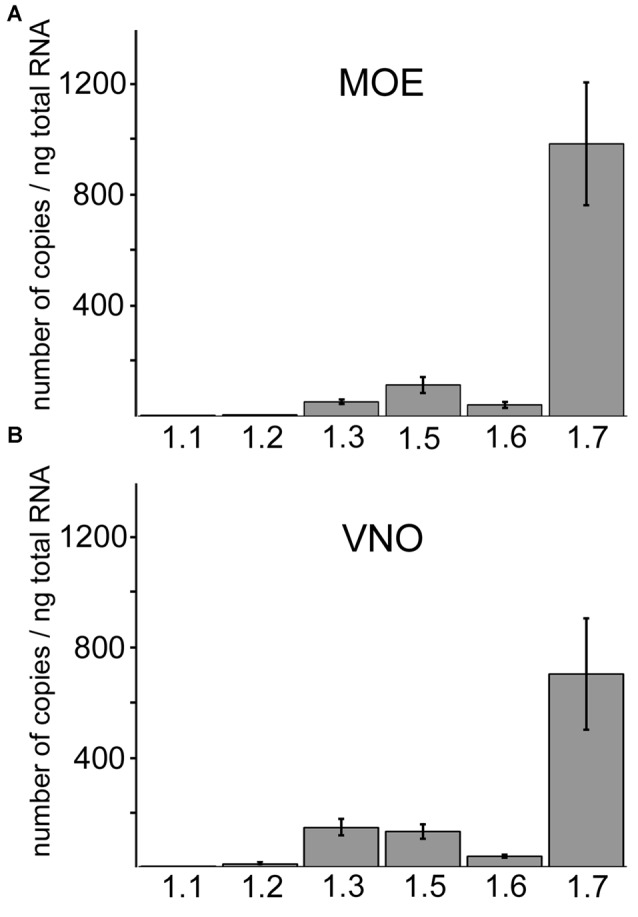
Quantitative RT-PCR of different Nav isoforms in main olfactory epithelium (MOE) and vomeronasal organ (VNO). Comparison of Nav channel mRNA frequency in the (A) MOE and (B) VNO using quantitative RT-PCR. Nav1.7 is the most abundant isoform in both subsystems and displays on average at least 5-fold higher copy numbers than other Nav isoforms. The column diagrams show mean copy numbers ± SD from two to four independent experiments, each carried out as triplicates using total RNA of adult C57/B6 mice (Y-axis). Nav channel isoforms (X-axis). (A) Copy numbers per ng total RNA in the MOE for Nav1.1 (2.6 ± 0.72), Nav1.2 (4.99 ± 0.62), Nav1.3 (51.80 ± 7.75), Nav1.5 (113.17 ± 27.35), Nav1.6 (41.19 ± 10.65), Nav1.7 (983.44 ± 221.34). (B) Copy numbers per ng total RNA in the VNO for Nav1.1 (0.80 ± 0.42), Nav1.2 (10.16 ± 2.10), Nav1.3 (142.70 ± 29.05), Nav1.5 (128.13 ± 25.56), Nav1.6 (38.17 ± 5.39), Nav1.7 (701.06 ± 203.50).
