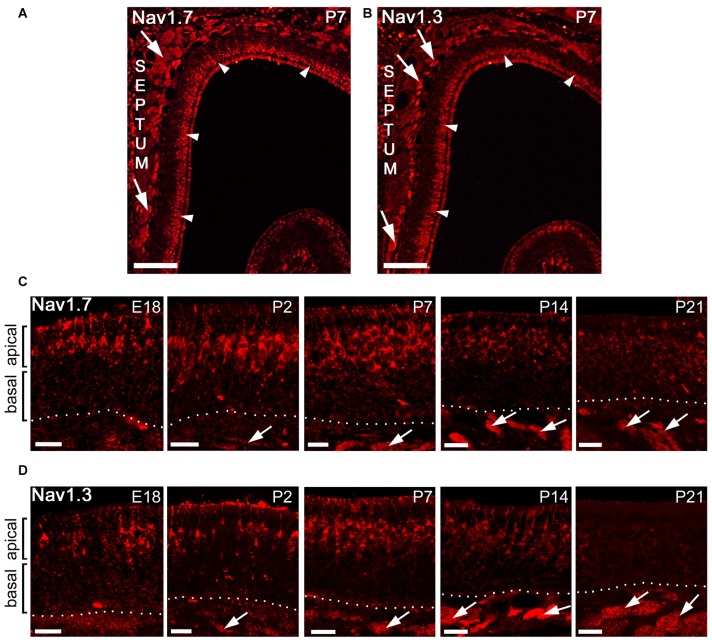
Figure 4.
Subcellular localization of Nav1.7 and Nav1.3 staining during mouse MOE development. (A,B) Coronal tissue sections showing the dorsal aspect of the left nasal cavity (septum to the left) of a postnatal day 7 (P7) mouse. A strip of strong immunoreactivity is visible for (A) Nav1.7 and (B) Nav1.3 in the most apical MOE layer (arrowheads) and in axon bundles (arrows). (C,D) Higher magnifications of the MOE derived at different mouse ages stained with antibodies for (C) Nav1.7 and (D) Nav1.3. The confocal images show strongly stained OSN somata solely in the apical MOE. Somatic OSN staining is visible at embryonic day 18 (E18), P2, and P7, declines at about P14 and is nearly diminished at P21. Axon bundles stain early on (arrows) and increase in size with age in relation to epithelial thickness. Images are representatives of (n ≥ 2) mice at each age with n ≥ 10 sections per mouse. Scale bars (A,B) 200 μm, (C,D) 20 μm.

