Figure 6.
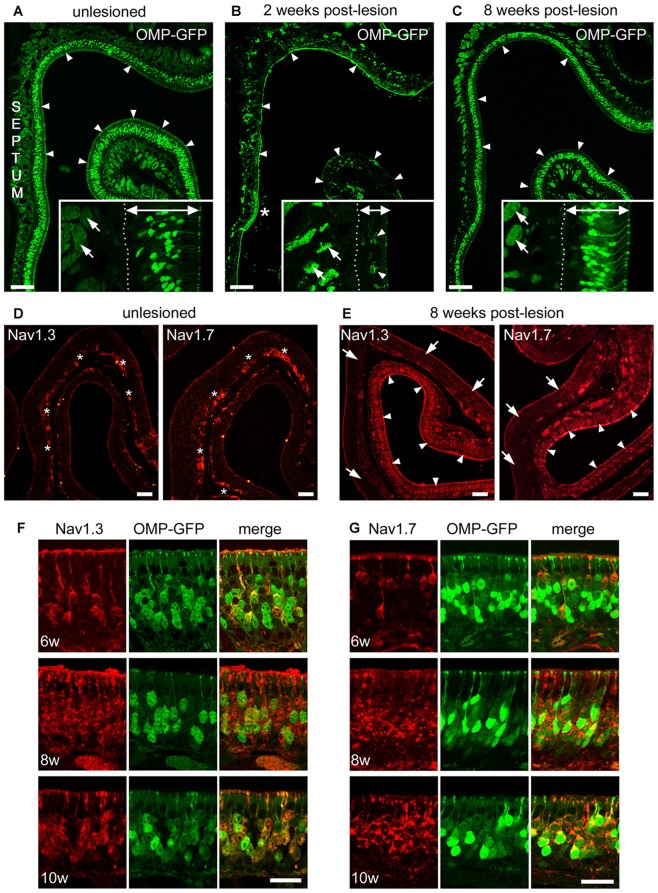
Recovery of Nav1.3 and Nav1.7 expression in OSN somata during regeneration from chemical ablation. (A–C) Coronal MOE sections of the anterior left nasal cavity (septum to the left) of OMP-GFP mice. (A) Untreated control mice display OMP-GFP labeling of OSNs throughout the MOE (arrowheads). Inset magnification exemplifies regular thickness of axon bundles (arrows) and the MOE (double arrow, 80 μm). (B) Severely damaged MOE 2 weeks post-lesion. Small patch of unlesioned MOE at the septal wall (asterisk). The inset magnification depicts the reduced thickness of axon bundles (arrows) and the MOE (double arrow, 35 μm) 2 weeks post-lesion. Few newly generated OMP-GFP positive OSNs are visible (arrowheads). (C) The MOE has largely recovered 8 weeks post-lesion (arrowheads). The inset magnification shows that the thickness of axon bundles (arrows) and the MOE (double arrow, 70 μm) is increased. Basal membrane (dotted line). (D) Immunoreactivity for Nav1.3 and Nav1.7 in the intact, unlesioned MOE shows strong labeling of axon bundles (asterisks). (E) Eight weeks post-lesion, tissue stretches with heavy immunolabeling for Nav1.3 and Nav1.7 in OSN somata (arrowheads) reside side-by-side with areas devoid of any somatic immunoreactivity (arrows). This pattern likely coincides with the different levels of initial damage yielding various levels of MOE regeneration. (F,G) Magnifications of the MOE at 6, 8, and 10 weeks post-lesion showing somatic staining for (F) Nav1.3 (red) and (G) Nav1.7 (red) colocalizing with OMP-GFP (green). Images are representatives of (n = 2) mice at each recovery time point with n ≥ 20 sections per mouse. Scale bars (A–C) 200 μm, (D,E) 50 μm (F,G) 20 μm.

