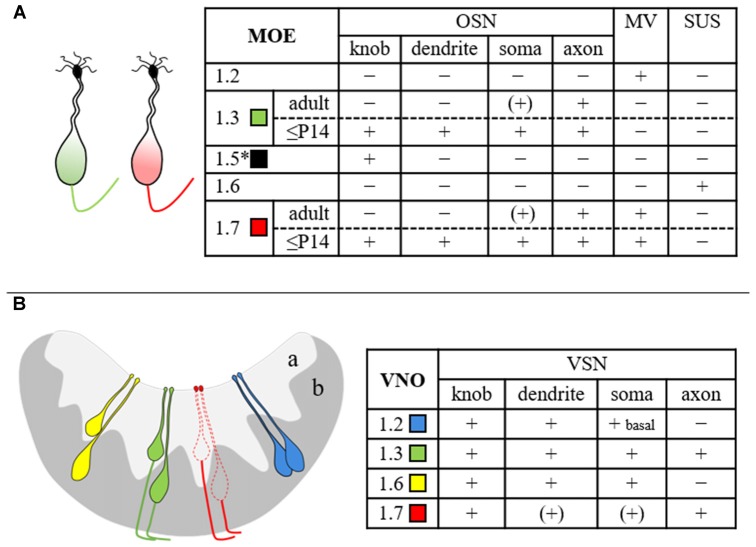
Figure 7.
Summary scheme depicting the cellular and subcellular distribution of various Nav channel isoforms in mouse MOE (A) and VNO (B). The drawings at the left illustrate the results obtained in this study and refer to the table at the right. Expression of Nav1.5 (asterisk) in OSN dendritic knobs (Frenz et al., 2014) has been included for completeness. The different Nav channel subtypes are color-coded as indicated. The extent of immunoreactivity was categorized as + (present), − (absent), or (+) (close to detection threshold). MV, microvillar cells; OSN, olfactory sensory neuron; SUS, sustentacular cells; VSN, vomeronasal sensory neuron; a, apical VNO layer; b, basal VNO layer.

