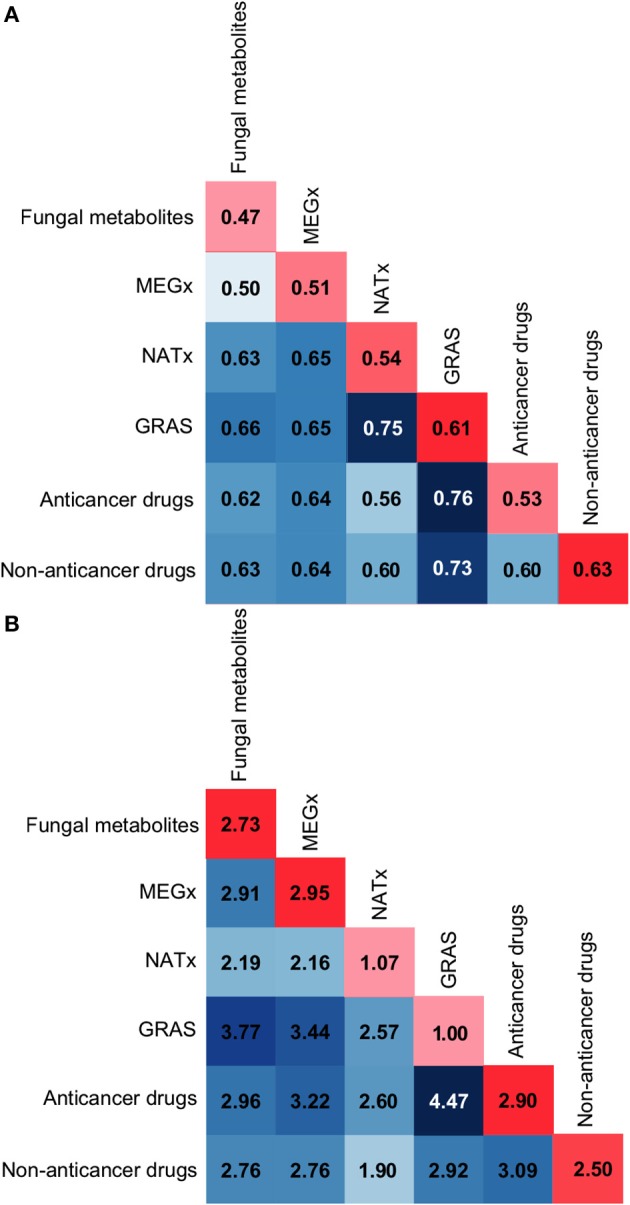
Figure 5.

Intra and inter-library similarity. The diagonal in red depicts intra-library comparisons, i.e., the similarity between the compounds in a data set. Dark red scores indicate large distance or low similarity, while light red colors indicate small distance or high similarity. The matrix in blue depicts inter-library similarity comparisons, i.e., the similarity between the compounds in the data sets. Dark blue scores indicate large distance or low similarity, while white or light blue colors indicate small distance or high similarity. (A) Soergel distance using MACCS keys (166-bit) fingerprints. (B) Euclidean distance function using molecular properties.
