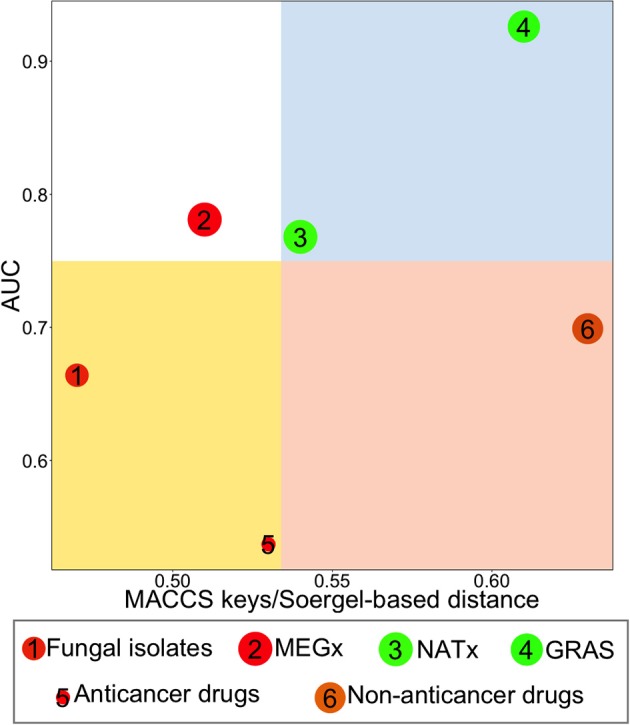
Figure 6.

Consensus Diversity Plot comparing the diversity of six data sets. The structural diversity was defined with MACCs keys fingerprints/Soergel-based distance and area under curve (AUC). The quadrants color codes are as follows: red, indicates the library is diverse considering its scaffolds and/or side chains; white, the library is not diverse; blue, the library is diverse if the chemical features of the entire molecule are considered and/or side chains contribute significantly to the diversity; yellow, the scaffolds of the molecules are the main factor contributing to the diversity and/or this set contains mostly rings with few side chains. Data points are colored by the diversity of the physicochemical properties of the data set as measured by the Euclidean distance of six properties of pharmaceutical relevance. The distance is represented with a continuous color scale from red (more diverse), to orange/brown (intermediate diversity) to green (less diverse). The relative size of the data set is represented with the size of the data point: smaller data points indicate compound data sets with fewer molecules. A value of 0.75 for AUC and the median value of the MACCs keys fingerprints/Soergel-based distance were used to set the quadrants.
