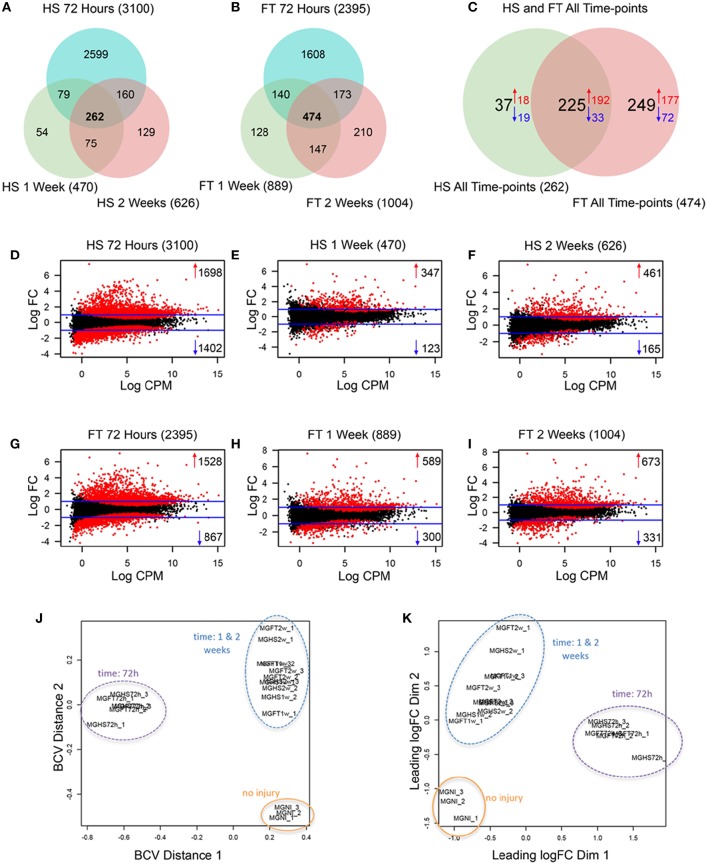
Figure 1.
Longitudinal analyses of de-regulated genes in microglia after 2 severities of SCI. (A–C) Venn diagrams displaying the number of deregulated genes in microglia isolated by flow cytometry at the indicated stages after HS and FT. Relationship between average expression and log 2 of the fold-change in microglia at different stages after HS (D–F) and FT (G–I) injuries. Horizontal blue lines indicate the cut off criterion used to define deferentially expressed genes with a FC >2 (logFC comprised between–1 and 1) and a significant false discovery rate (FDR) values (p < 0.05). Red points indicate significantly deregulated genes following injury. Multidimensional scaling plots displaying distances, in terms of biological coefficient of variation (J) and fold change (K) in microglia at different stages after HS and FT injuries relative to NI control.

