Figure 2.

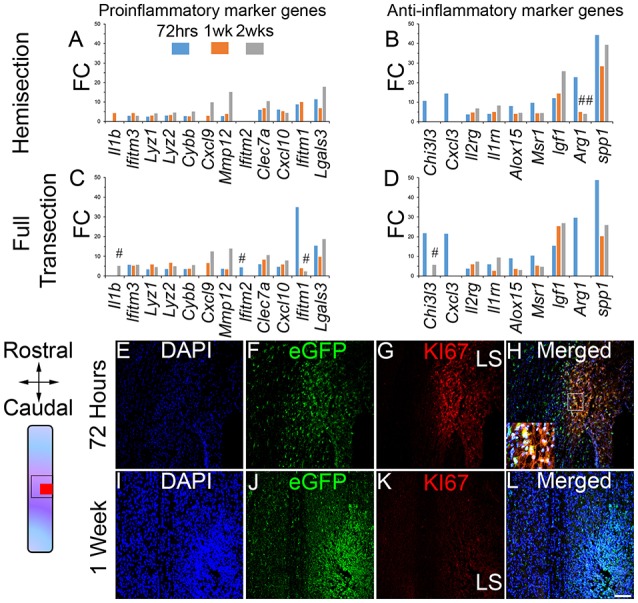
Acute inflammatory response and proliferation of microglia after SCI. Bar graphs displaying alterations in pro-inflammatory and anti-inflammatory marker genes in microglia after HS (A,B) and FT (C,D). Values are actual fold change. # represents transcripts with different expression between the two lesion severities at the same time-points after injury. Schematic drawing of longitudinal spinal cord sections from HS groups illustrating the lesion site (red square) and reference frames for displayed field of views. Confocal micrographs indicating proliferation of microglia at 72 h after SCI (E–H). Proliferation of microglia ceased by 1 week after injury (I–L). Scale bars (E–L), 100 μm. LS, lesion site. (E–H) HS 72 h and (I–L) HS 1 week. FC, fold change.
