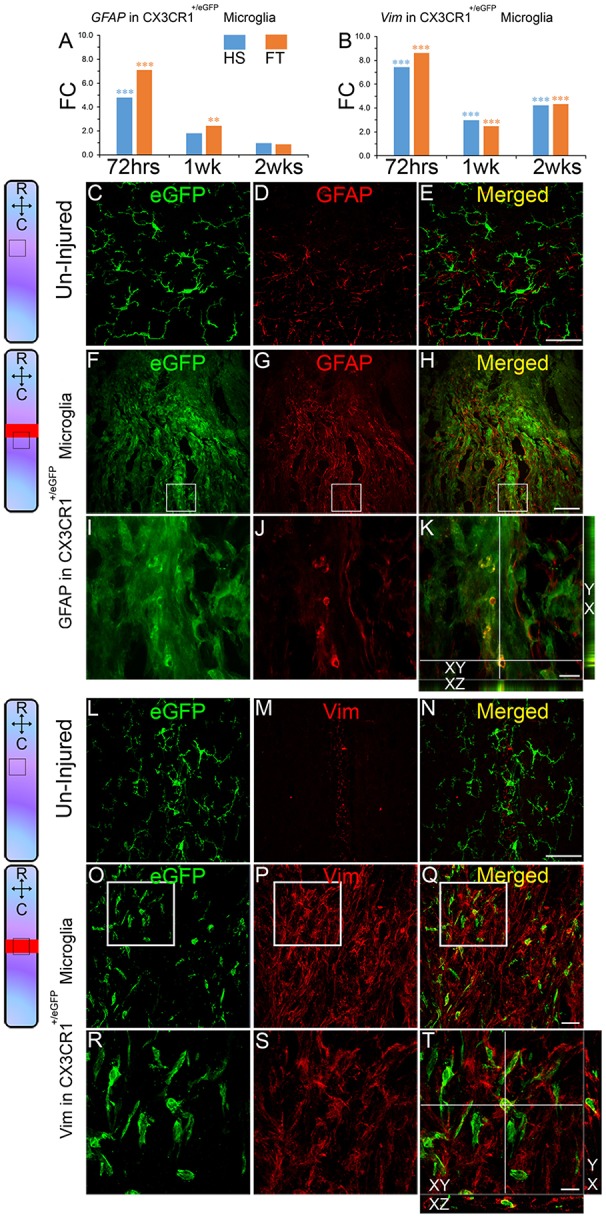
Figure 3.

Astroglial marker expression by microglia after SCI. Bar graphs indicating up-regulation of Gfap and Vim transcripts expressions in microglia after SCI (A,B). Values are actual fold change (**p < 0.01; ***p < 0.001 by t-test). Schematic drawing of longitudinal spinal cord sections from non-injured control and after FT illustrating the lesion site (red rectangle) and reference frames for the displayed fields of view. Confocal micrographs of longitudinally cut non-injured spinal cord section showing no eGFP/GFAP (C–E) or eGFP/vim (L–N) co-expression. Following SCI eGFP/GFAP (F–K) and eGFP/vim (O–T) protein co-expressions were evident in a sub-population of microglia in CX3CR1+/eGFP mice. Small insets in K,T are orthogonal projections of confocal z-stacks, which show eGFP co-localization with GFAP and vim, respectively (confocal z-stack with XY, XZ, and YX views). Scale bars (C–E,L–N), 50 μm; (F–H), 100 μm; (O–Q), 25 μm; (I–K, R–T), 10 μm. LS, lesion site. (C–E,L–N) non-injured and (F–K,O–T) FT 2 weeks.
