Figure 4.

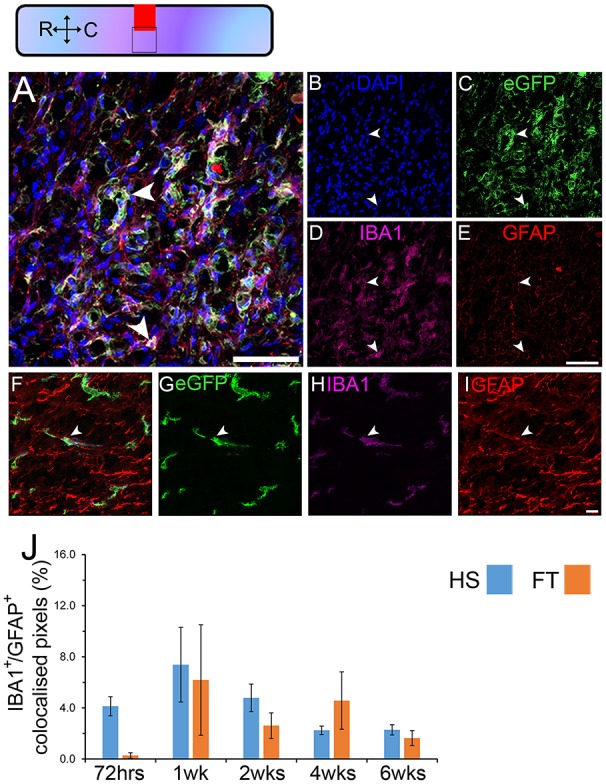
Astrocytic marker expression in microglia continues up to 6 weeks after different lesion severities. Schematic of longitudinal spinal cord section after HS SCI illustrating the lesion site (red square) and reference frames for the displayed fields of view. Confocal micrographs showing DAPI (B), eGFP (C), IBA1 (D) and GFAP (E) in CX3CR1+/eGFP. Micrographs were taken from regions adjacent to the lesion site (overlap of red and black squares in the schematic view). Higher magnification images, acquired from the same spinal cord, further from the lesion (black square without overlap with the lesion in the schematic view) confirmed the presence of IBA1/GFAP co-expressing cells (F–I). Quantitative analysis of IBA1/GFAP co-expressing cells (arrowheads in A,F) in the 2 lesion severities at multiple stages after SCI (J). Scale bars (A–E), 50 μm; (F–I), 10 μm. Bars represent mean ± SEM. 225 × 225 μm2 images were taken adjacent to the lesion center for each given animal and the colocalization coefficient were measured between the two channels. In total we assessed colocalization within 6750 × 6750 μm2 surface area adjacent to the lesion site in 5–7 animals at each given time-point. Colocalization analysis was performed using the Carl Zeiss LSM-710-NLO software. (A–E) HS 4 weeks, (F–I) HS 1 week.
