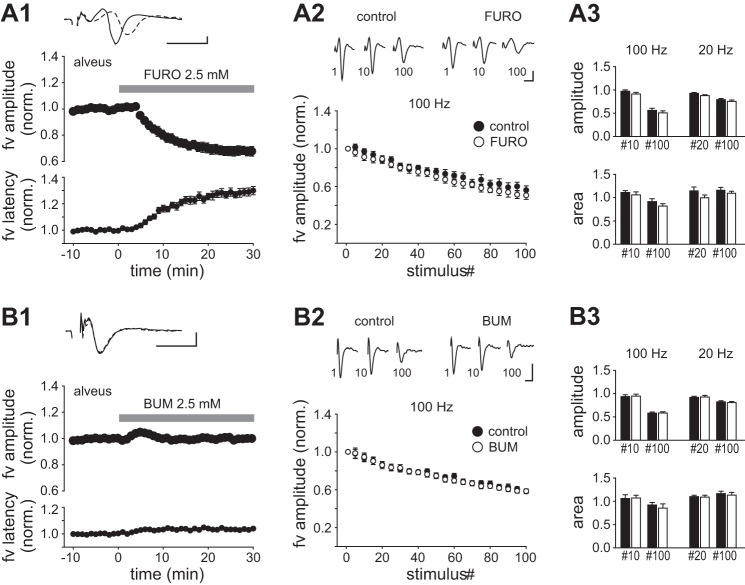
Fig. 6.
Effects of furosemide and bumetanide on fiber volleys in the alveus. A1: time course of the amplitude and latency to peak (normalized) of the fiber volley measured in the alveus before and during perfusion of furosemide. Top: example records show fiber volley before (solid trace) and after 29–30 min in furosemide (dashed trace). A2: fiber volley amplitude as function of stimulus number in HFS trains of 100 Hz before (control) and after exposure to furosemide for >30 min (FURO). Top: records of fiber volleys evoked at stimuli 1, 10, and 100 (100 Hz). A3: comparison of the normalized amplitudes (top) and areas (bottom) of fiber volleys evoked at stimuli 10 (100 Hz), 20 (20 Hz), and 100 (100 Hz and 20 Hz) taken from control period (filled bars) and in the presence of furosemide (open bars). B: plots as in A, but instead of furosemide bumetanide (20 µM, 30 min) was perfused. All recordings were done with CNQX (20 µM), MK 801 (10 µM), and CGP55845 (2 µM) present. Scale bars: 1 ms, 2 mV.

