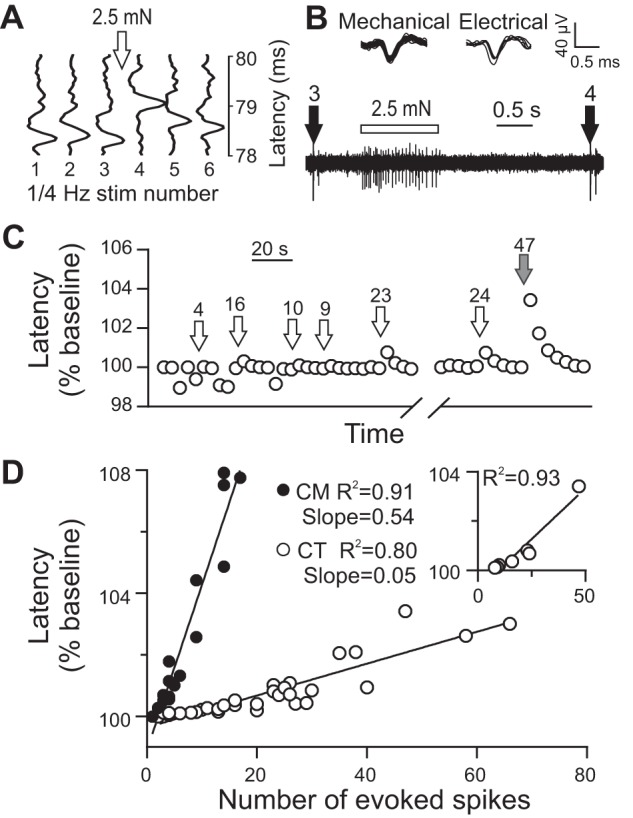
Fig. 2.

Marking responses in CT and CM afferents. A: during electrical stimulation at 0.25 Hz, physiologically stimulating the CT unit (between electrical stimuli 3 and 4) increased the latency to electrical stimulation. The relative timings of sensory and electrical stimuli are shown on the original trace in B. C: extent of latency changes to 7.4-mN monofilament (open arrows) and brush (filled arrow) stimulation in a CT unit is related to the number of evoked spikes (numbers above arrows). Some shorter-latency spikes were seen, presumably originating from a shorter axonal branch, and were excluded from the analysis of latency shifts. D: number of evoked spikes correlated significantly with the observed latency changes in both CT (P < 0.001) and CM (P < 0.001) units, with significantly different slopes (P < 0.001). Inset: the same data for the unit shown in C (P < 0.001). Data presented are from 36 markings from 8 CTs and 16 markings from 8 CMs.
