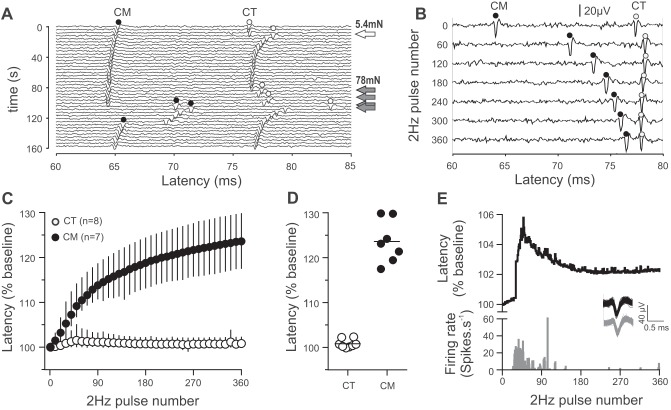
Fig. 3.
Latency changes during 2-Hz stimulation in CM and CT afferents. A: marking responses [indicated with filled (CM) and open (CT) circles] show that both the CT and the CM responded to the 78-mN monofilament and the CT neuron responded to the 5.4-mN monofilament. B: raw records of units shown in A to 2-Hz electrical stimulation, with every 60th electrical stimulation displayed. C: latency changes in all CT and CM units during 2-Hz electrical stimulation. For clarity, every 10th stimulation is displayed; symbols and error bars denote mean and range, respectively. D: scatterplot of latency changes at the 360th pulse during 2-Hz stimulation in CTs and CMs; lines indicate means. E: nonelectrically evoked spikes during 2-Hz electrical stimulation induce a latency increase that recovers as the firing stops. Inset: traces show overlaid electrically evoked (black) and nonelectrically evoked (gray) spikes.

