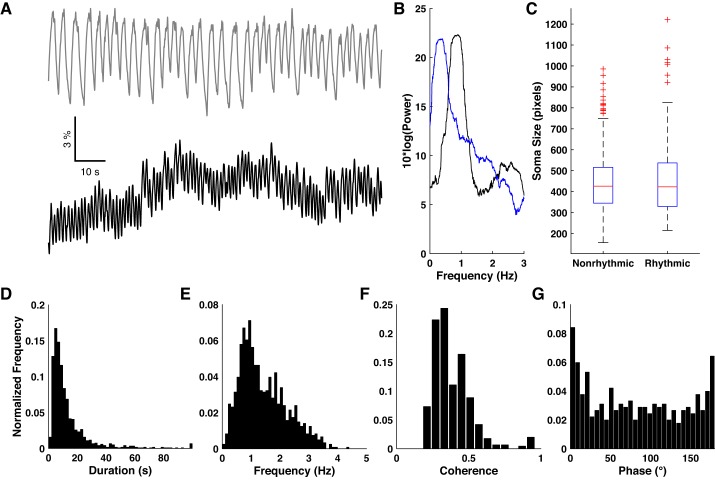
Fig. 3.
Spontaneous rhythmic activity. A: representative example of two neurons showing highly rhythmic activity in baseline ACSF. B: Fourier power spectra of the binarized traces derived from the two traces in A. C: comparison of soma size between nonrhythmic and rhythmic cells. D and E: normalized histograms of basic properties of rhythmic epochs under baseline conditions. F and G: normalized histograms of coherence magnitude and phase angle for all pairs of neurons exhibiting statistically significant coherence.

