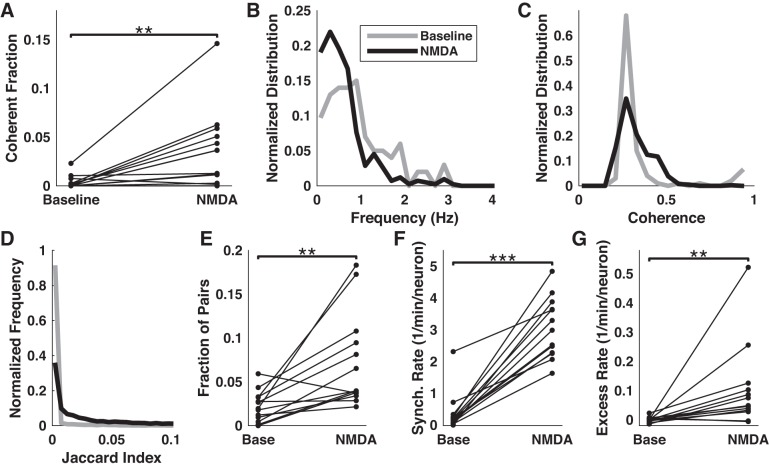
Fig. 7.
Effects of NMDA on network activity. A Comparison of the fraction of pairs of neurons showing statistically significant coherence before and during application of NMDA. B and C: distributions of frequencies of peak coherence and magnitude of coherence before and during NMDA stimulation. D: normalized histograms of Jaccard indices pooled from all pairs of neurons under baseline (gray) or NMDA (black) condition. E: fraction of pairs of neurons that were identified as functionally connected under each condition. F: the overall rate of synchronous events increased during NMDA application. G: excess rate of 4+ neuron-synchronous events (relative to upper 99% confidence interval) increased during NMDA application. **P < 0.01 and ***P < 0.001.

