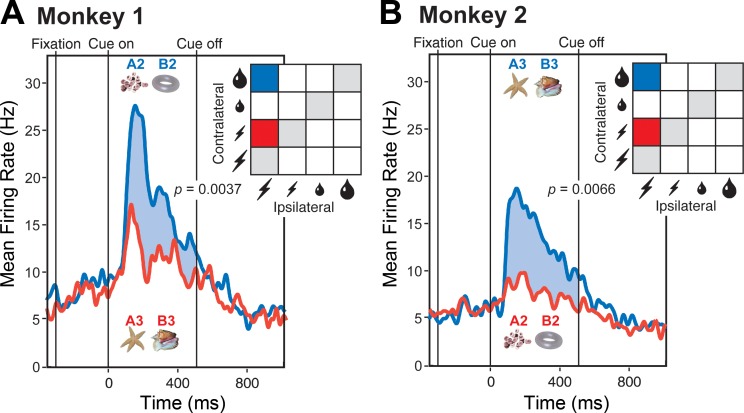
Fig. 3.
The strength of the population response depended on the associations of the cues as distinct from their physical properties. A: in monkey 1, images A2 and B2 predicted a large reward, whereas images A3 and B3 predicted a small penalty. B: in monkey 2, the pairing of the images with the outcomes was reversed. In each monkey, the cues predicting a reward elicited a significantly stronger response (blue curve) than the cues predicting a penalty (red curve). In each panel, P is the outcome of a 2-tailed paired t-test, with n as indicated, comparing firing rates under the conditions represented in the panel.

