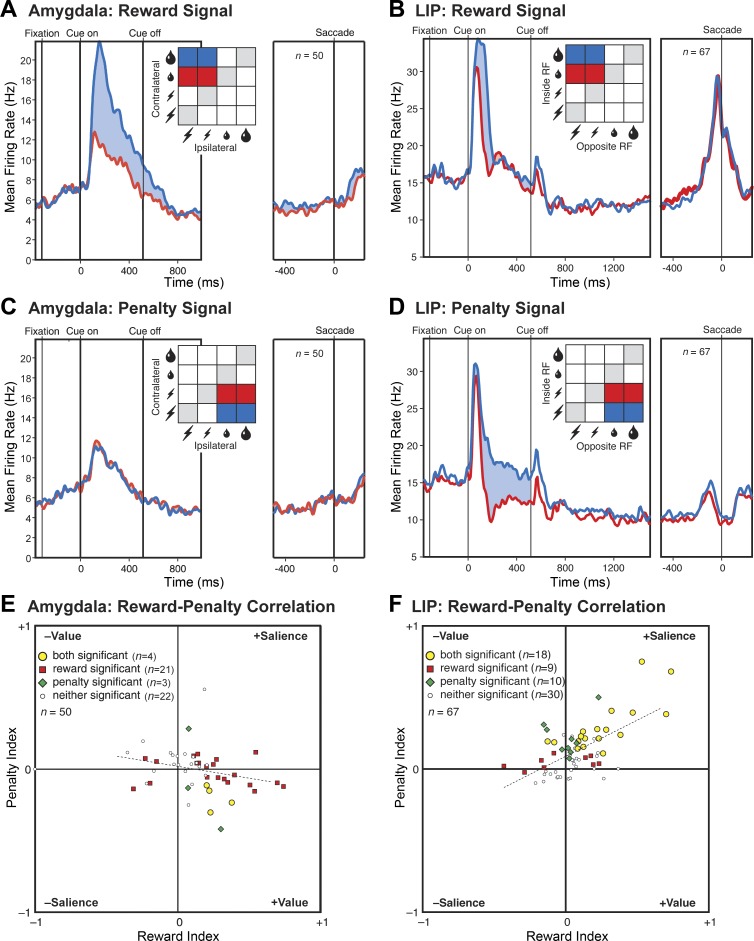
Fig. 6.
Comparison between the amygdala and LIP on 3 key effects. A and B: reward signal. Population mean firing rate as a function of time during the trial when the cue contralateral to the recording hemisphere predicted large (blue) vs. small (red) reward. Conventions as in Fig. 2A. C and D: penalty signal. Population mean firing rate as a function of time during the trial when the cue contralateral to the recording hemisphere predicted large (blue) vs. small (red) penalty. Conventions are as in Fig. 2D. E and F: correlation across neurons between the reward signal and the penalty signal. Conventions are as in Fig. 5C. Data from LIP are from a prior report by the authors (Leathers and Olson 2012).

